By: Andrew Oh, Christina Park, Jiwoo Lee, and Diane You
Introduction:
In our previous project, we were intrigued by the birth rate demographics in America and their correlation with ethnicity. We attempted to see if there were any similarities or differences in the natality trends among Americans, Asian Americans, and individuals in their respective mother countries. After further examination, we concluded that Asian Americans were prone to follow the demographics of their mother countries. However, our analysis relied heavily on unprocessed data from the web, limiting our ability to explore nuanced insights. This time, we took matters into our own hands. We took a more proactive approach by gathering data from multiple authoritative sources, including datasets comparable to the U.S. Census, to ensure a comprehensive and rigorous analysis.
As a continuation of our last project, we decided to branch out our scope to not only look at whether Asian Americans are more similar to their mother countries or America, but we also put in the effort to explain the demographics of natality in each country. And of course, check to see if the data we collected last time is valid and correct. Before examining the data, it is important to define what natality means. Simply put, natality refers to the birth rate within a population. For this research project, we concentrated on three East Asian countries: Korea, Japan, and China. To test our hypothesis and draw meaningful conclusions, we analyzed three key factors related to natality: the crude birth rate (CBR), the total fertility rate (TFR), and the mean age of childbearing mothers (MAC).
The primary goal of this research was to prove or disprove our hypothesis: Asian Americans will follow similar trends to their mother countries. However, whilst exploring our data we found a more astonishing trend; the four countries’ demographics seem to be aligning more closely than we originally thought.
Crude Birth Rate (CBR):
Our first consisted of comparing the crude birth rates of the East Asian mother countries, Asian Americans, and America. According to the World Health Organization, the crude birth rate, computed as a ratio, is the annual number of live births per 1,000 population. Our group calculated the crude birth rate (CBR) by first obtaining the annual values for Korea, Japan, China, and the United States directly from the United Nations dataset. For East Asian subpopulations within the United States, however, we had to consolidate multiple data sources to estimate the CBR for each subgroup. The CBR was calculated using the formula: CBR = Number of Births in the PopulationTotal Population1000. Furthermore, to determine the number of births for each East Asian subpopulation (Korean Americans, Japanese Americans, and Chinese Americans), we consulted the Center for Disease and Control and Prevention (CDC)’s natality dataset, which provided the total number of births to mothers of each respective race from 2012 to 2022. We then obtained the total population data for each racial group in the United States for each year from the U.S. Census American Community Survey. With these datasets, we were able to complete the necessary calculations for the CBR.
We improved the accuracy and clarity of the data by applying a one-dimensional Gaussian filter to smooth the calculated values. Finally, we graphed the CBR over the years for East Asian Americans, comparing these trends to those of their native countries as well as the overall U.S. population. This methodology allowed us to analyze and visualize birth rate trends across different populations over time.
Results and Interpretations:
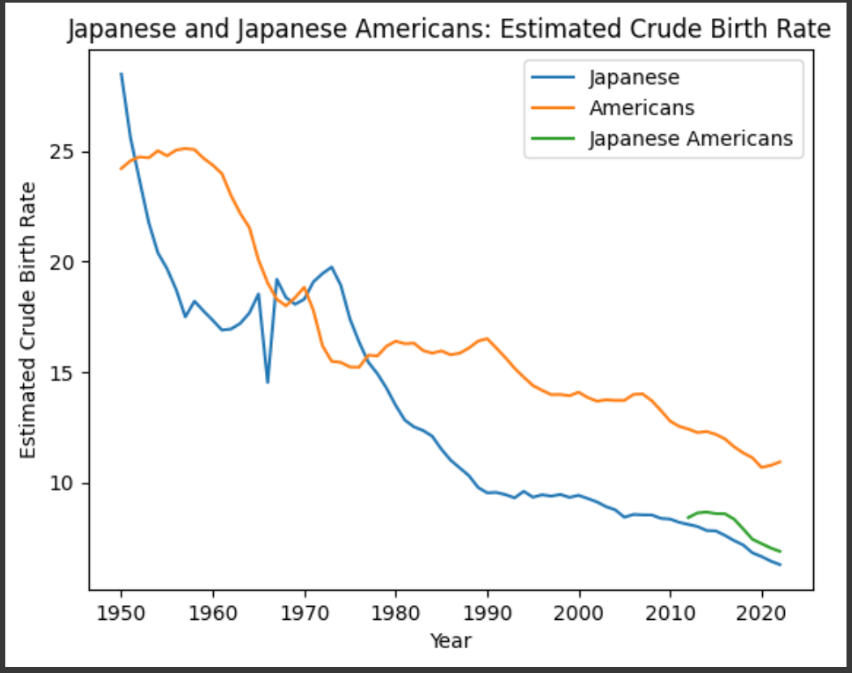
Japan’s rapid reduction in its crude birth rate has led to an accelerated transition into Stage 5 of the demographic transition model. This is particularly notable in the comparison between the crude birth rates of Japanese and Japanese Americans. Data from 2012 and 2022 reveal that Japanese Americans’ crude birth rates closely mirror those of Japan, indicating a similar demographic trend. In 2012, Japan’s CBR was 8.108, while Japanese Americans had a rate of 8.420. By 2022, Japan’s CBR had dropped to 6.293, and Japanese Americans’ rate had decreased to 6.89. This suggests that the Japanese American population is following a demographic trajectory closely aligned with Japan, likely influenced by similar cultural, economic, and societal factors contributing to their low birth rates.
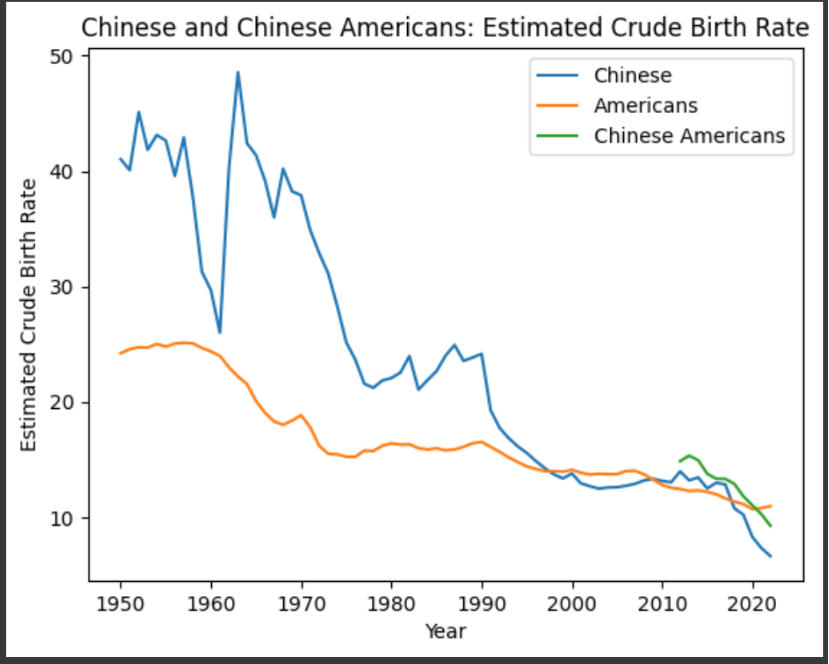
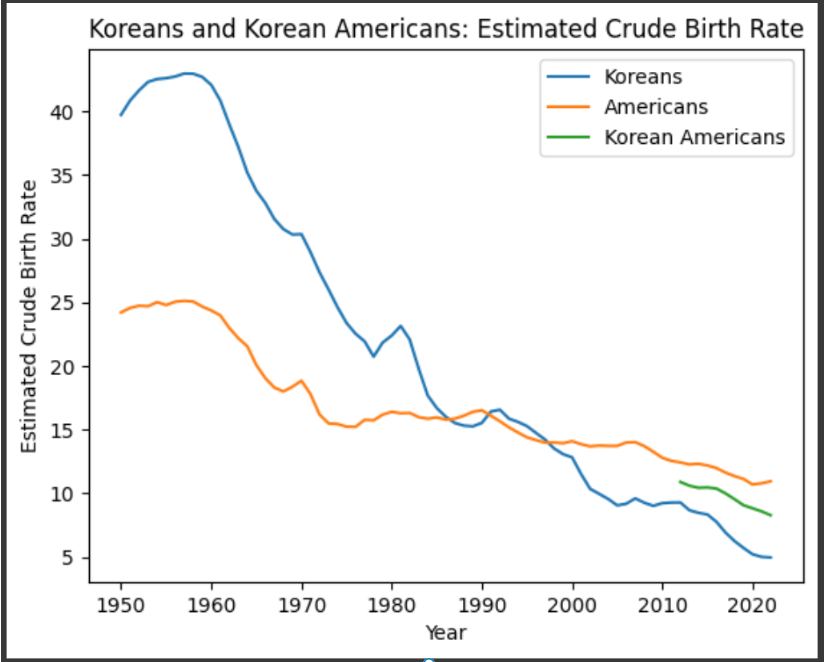
Not only does Japan’s data align with our hypothesis, but so does China and Korea. If we take a closer look at the graphs, it is evident that the Chinese and Korean Americans are visually following a closer slope with their mother countries, but also in numbers. Both Korean Americans and Chinese Americans are below the numbers of American births starting in 2010 and on. So through our analysis of crude birth rate, we can generally see that mother countries have an influence on their matching American ethnicity group.
Total Fertility Rate (TFR):
The next comparison our group made is through the calculations of the Total Fertility Rate. According to the Organization for Economic Cooperation and Development, the total fertility rate in a specific year is defined as the total number of children that would be born to each woman if she were to live to the end of her childbearing years and give birth to children in alignment with the prevailing age-specific fertility rates.
For the total fertility rate, we got the values for each year directly from the UN dataset for Korea, Japan, China, and the United States. When it came to the East Asian subpopulations in the United States, we used data from the US Census American Community Survey to approximate the TFR for each subpopulation as shown:
Women 15 to 50 years who had a birth in the past 12 months Women 15 to 50 years35
Results and Interpretations:
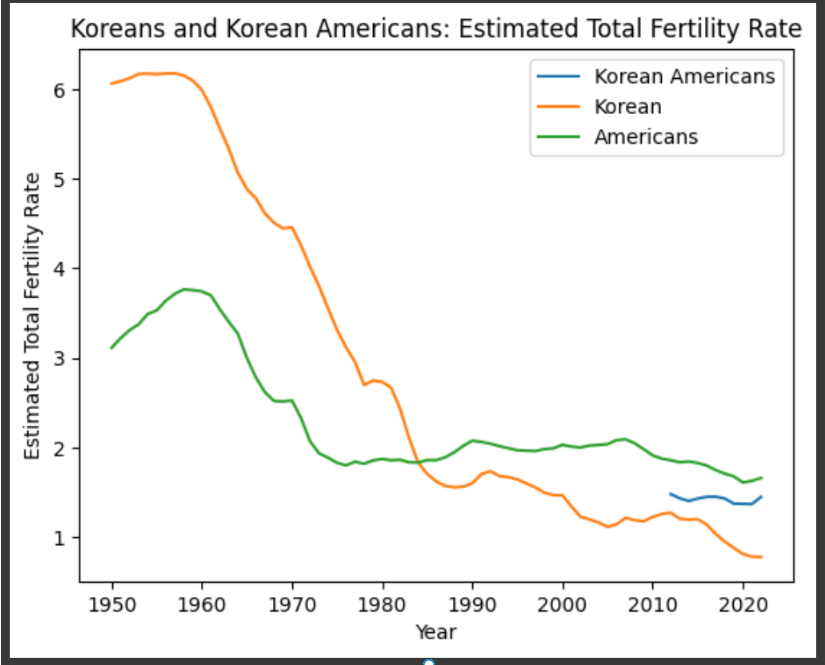
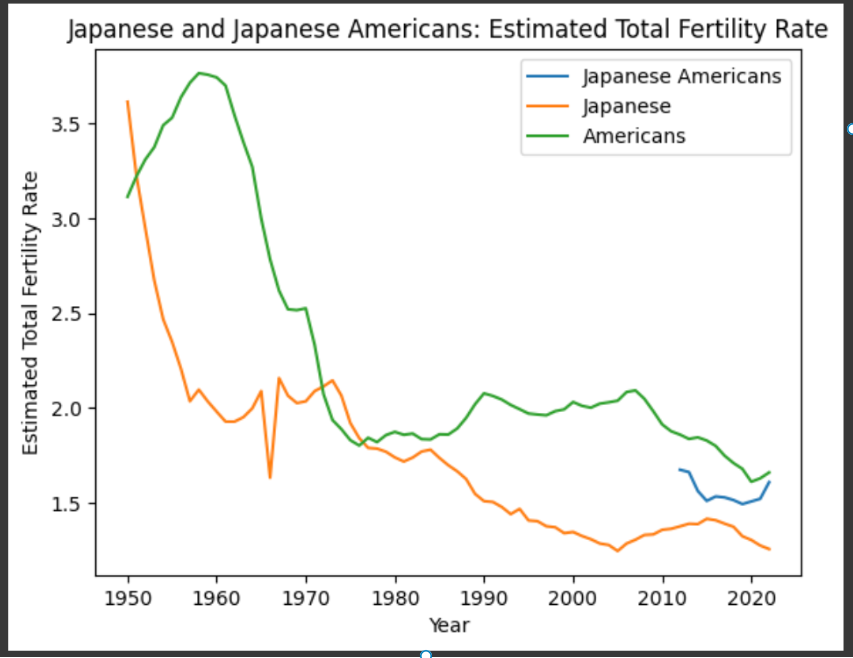
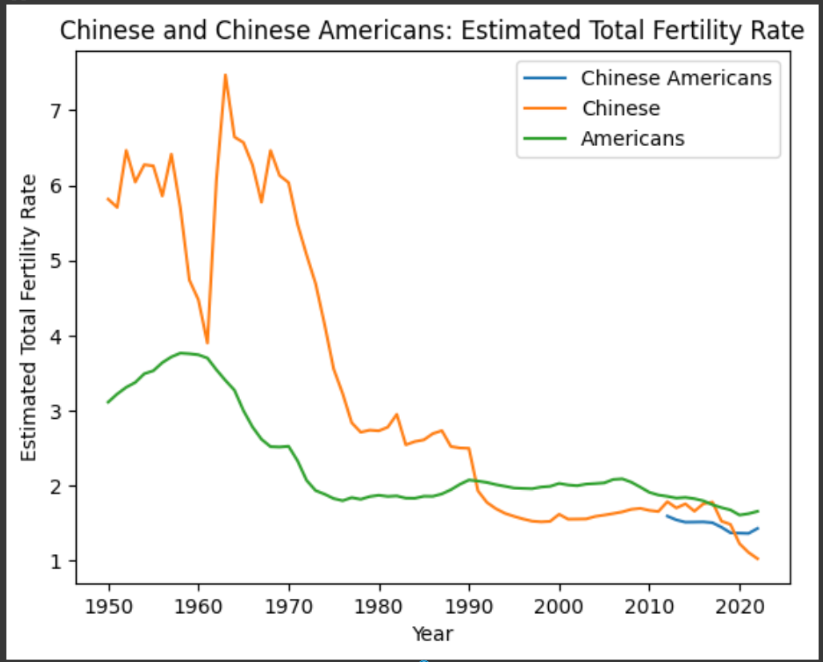
As we can see in all three graphs, it is evident that there are many swings in the data throughout the years. In general, the number of children born to each mother has gone down significantly. This was something we had expected, as we knew that all these countries were in the later stages of demographics. What surprised us the most was that every Asian American population had total fertility rates closer to that of the USA according to our similarity tests. For our cosine similarity test, each East Asian American population showed a 0.999 similarity with the American population.
However, the fact that the total fertility rate for Koreans, Japanese, and Chinese people in America for 2022 was less than that of the overall American rate shows that some correlation remains. It appears that although we see some correlation in the total fertility rates to those of the home countries, the downward trends for the East Asian countries are more drastic than those found in the United States where they are more stable.
This created an interesting pattern. The fertility rates were noticeably smaller for East Asian Americans than those of Americans overall, indicating trends that match the home countries. However, the fluctuations and changes in the rates were remarkably similar to those of Americans. This shows us that both geographic and cultural influences can affect birth trends.
Mean age of Childbearing (MAC):
The last comparison method we used in comparing the calculations of mean age of childbearing. According to the United Nations, the mean age at childbearing is computed as the sum of age-specific fertility rates weighted by the mid-point of each age group, divided by the sum of the age-specific rates. To put it in simple terms the mean age of childbearing is the average age at which women in a population give birth. To calculate the mean age of childbearing (MAC), we obtained data in the same way as we did for crude birth rates. The calculation for the mean age of childbearing was performed using the following formula:
MAC = (Number of births in age bucket Midpoint of age bucket)Total number of births.
For each racial group, we totaled the number of births within each age group, multiplied by the midpoint of the corresponding age range. The sum of these weighted values was then divided by the total number of births for the respective population. This approach provided an estimate of the average age at which women in each group were giving birth.
Results and Interpretations:
Over the years, both American and Asian countries have experienced a noticeable increase in the average age of mothers at childbirth. However, a deeper analysis reveals that since 2012, Asian American populations have surpassed both their mother countries and the United States in maternal age. This trend underscores a unique demographic pattern: Asian Americans are not only mirroring trends in both regions but also having children at an even later age. Previous data suggested that Asian Americans were similar to their respective mother countries, particularly Koreans. However, our updated analysis from 2012 to 2022 reveals a more nuanced picture. By examining the data, it is evident that Asian Americans have outpaced both their countries of origin and the United States in maternal age.
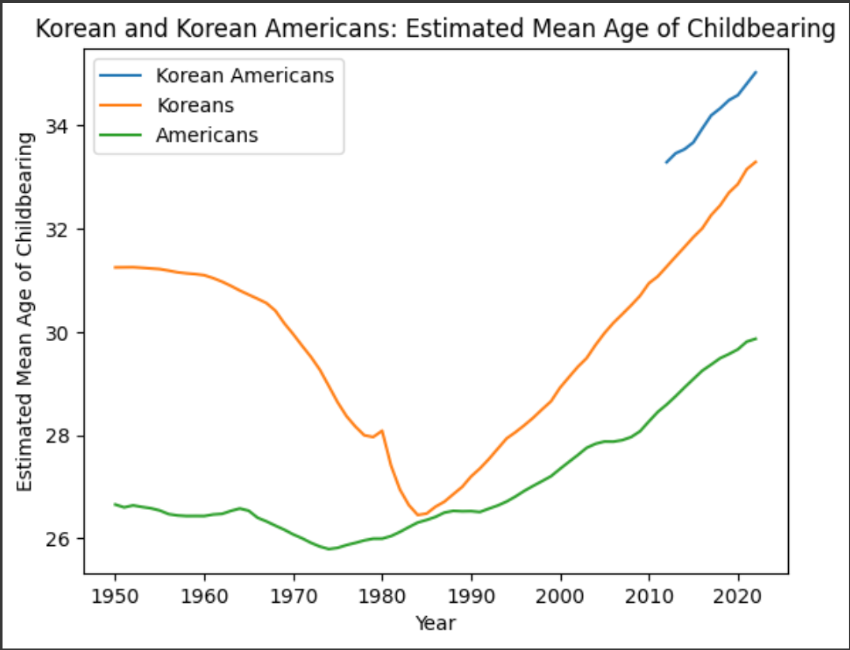
After a decline in the mean maternal age around 1985, Korean mothers have shown a consistent trend toward later childbirth. By 2022, the average maternal age in Korea reached 33.297 years, while in the United States, it stood significantly lower at 29.868 years. Interestingly, Korean Americans exhibited an even higher average maternal age of 35.033 years in 2022. This trend, observable since 2012, indicates that Korean Americans may be consciously or subconsciously aligning more closely with the demographic patterns of Korea rather than the United States.
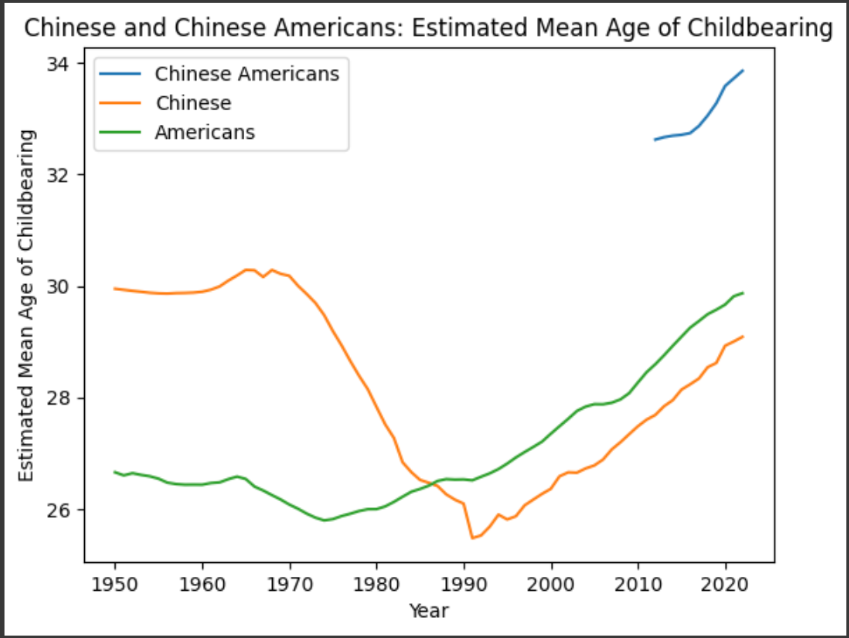
China presents a particularly intriguing case. Historically, from 1950 to 1990, Chinese mothers maintained a relatively high average maternal age of 30. However, this figure saw a steep decline till 1990, coinciding with the implementation of the one-child policy in 1974. Since then, the average maternal age has gradually rebounded, reaching 29 years in 2022. Surprisingly, the average maternal age in the United States during the same period was slightly higher, at 29.868 years. Chinese Americans, however, exhibit a much higher maternal age, averaging nearly 34 years in 2022. This suggests a significant divergence between Chinese Americans and the demographic trends of their mother country.
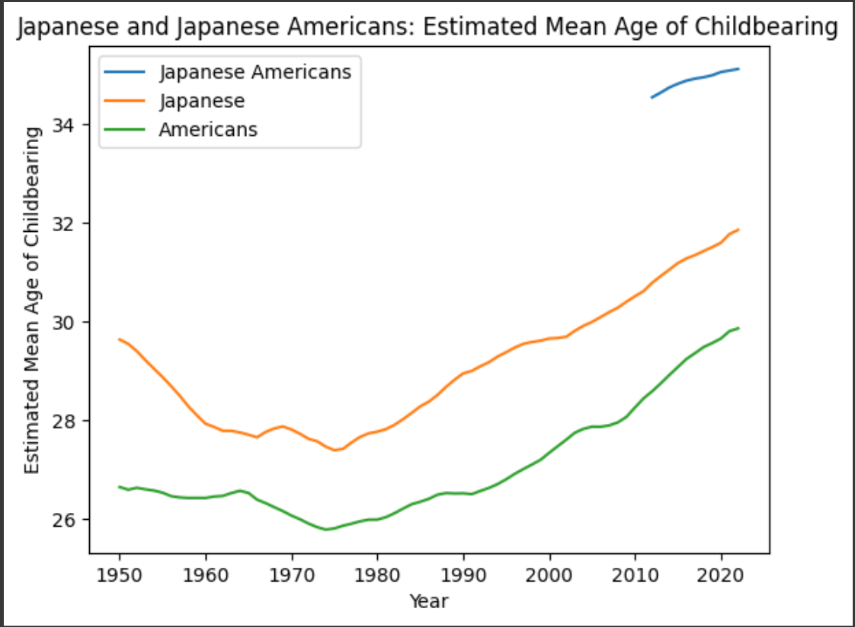
Over the years, the slopes of maternal age trends in Japan and the United States have been remarkably similar. By 2022, the average maternal age in Japan was 31.864 years, compared to 29.868 years in the United States. Japanese Americans, however, surpassed both countries, with an average maternal age approaching 35 years. This supports the hypothesis that Japanese Americans are more closely aligned with the demographic patterns of their mother country than with the United States.
Confounding Variables:
Population and demographic studies across different ethnicities and countries often involve numerous confounding variables that can complicate analysis and interpretation. Factors such as socioeconomic status, access to education, healthcare availability, cultural practices, geographic location, and historical context can all interact in complex ways. These variables can influence outcomes independently or in combination, making it challenging to isolate the effects of any single factor. Still, the data we have collected throughout this project show that there is a clear correlation between Asian countries and Asians in America.
It is also important to note that we made many calculations and approximations that may not represent each situation one hundred percent accurately. However, for our purposes of general reporting and trend analysis, our data and found correlations are still significant.
Final Reflection:
With the help of Professor Sun Kim of USC, our four-month research project, we proved our hypothesis to be correct, with of course the fact that confounding variables may always open up casualties in our data. However, we were also able to reveal through analyzing our data, using prior knowledge, and extra research, that all four countries under study—Korea, Japan, China, and the United States—are positioned in Stage 4 or 5 of the Demographic Transition Model. As a result, instead of observing stark contrasts, we identify notable similarities in the patterns of population and natality dynamics. This alignment underscores shared demographic challenges and trends, such as declining birth rates and aging populations, despite variations in cultural and socio-economic contexts. The similarities between America and the corresponding mother countries make it so that in general the Asian American population likewise aligns with the same demographics as the years get more recent. Through our project, we hope to deepen the understanding of how ethnicity influences natality among Asian Americans, both consciously and subconsciously. By examining data, all of our team members were able to learn more about our own mother country: Korea; ultimately, we hope our findings will contribute to a more informed and nuanced dialogue surrounding ethnicity and its impact on the Asian American experience in the context of natality.


”")
")
")