By: Sion Park, Ray Yoon, Henry Ji, and Stella Jeong
Introduction
Over the past five months, our team has participated in the Korean Daily Data Science (KDDS) internship under the assistance of USC professor Seon Kim. We analyzed the LAPD OpenData’s crime records from 2010 to 2023 (Crime Data from 2010-2019 and Crime Data from 2020 to present). This article will interpret the theft trends from this time frame, exploring the trends using the victim counts provided by the data sets along with other factors like Geographical Areas, dates these incidents occurred, and traits of the victims such as race, age, and gender.
Overview
California is one of the most crime-ridden states in the United States. In many cities, countless crime reports are filed daily, and Los Angeles is no exception. Many different types of crimes are present in LA, one of the most common being theft, which will be the primary focus of this article. We analyzed observations identified in theft trends, including the gender and age of the victims, the locations of the thefts, and the dates on which the thefts occurred. We will focus on six types of theft; Burglary, Robbery, Theft from Motor Vehicle – Petty, Theft from Motor Vehicle – Grand, Petty Theft, and Grand Theft. To further define and explain these categories, Burglary is an illegal entry of a building to commit a crime, primarily theft. Robbery is the act of taking a person’s property unlawfully by force or threat of force. Petty Theft is the unauthorized taking of property worth $950 or less, such as shoplifting and stealing low-value property or goods. Grand Theft is the same as Petty Theft, except the property is worth more than $950. Theft from Motor Vehicle – Petty is theft or attempted theft from a motor vehicle, such as stealing from a parked car. Theft from Motor Vehicle – Grand is similar to Theft from Motor Vehicle – Petty but with the requirement that the property stolen is worth more than $950.
Age of Victim
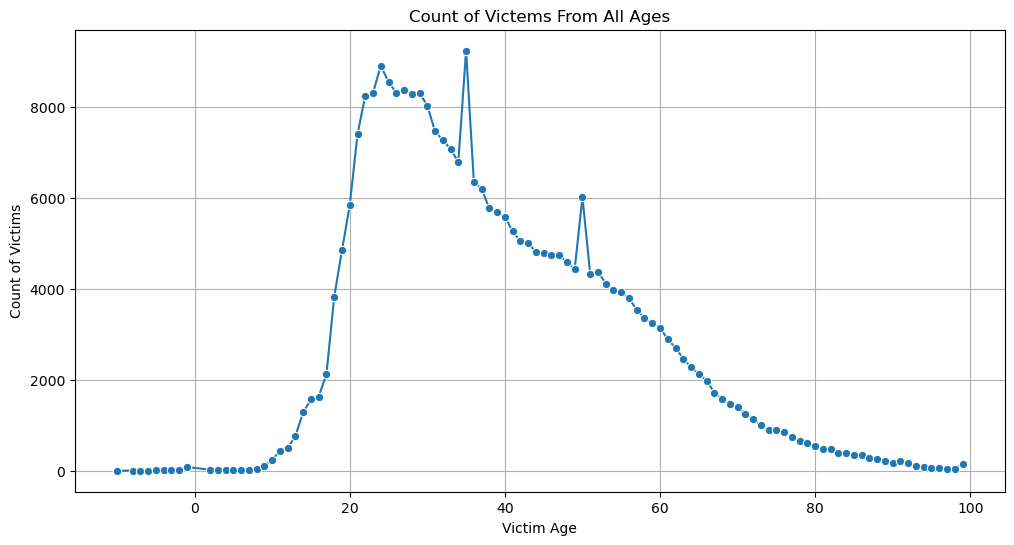
This line graph plots the theft occurrences for each age. Our initial hypothesis when comparing victim counts throughout the ages was that older people will be more likely to be victims of theft. According to our analysis, we can see from this graph that there is a substantial spike in the number of victims of theft in the late 20s age group. After the spike, the victim count gradually decreases as the age gets larger. This was unexpected since we hypothesized elderly people are more vulnerable physically, therefore encouraging criminals to steal from them. Another noticeable trait of this graph is that there are temporary spikes specifically ages 35 and 50, although this does not seem to correlate to anything.

For these line graphs, we plotted the most common age of each theft type throughout each year. The lines have a great variance for each theft type graphed. We can see that Burglary seems to occur quite frequently among victims aged 35-40. Burglary compared to other theft types is committed in the oldest age range; it holds the highest common age of 50 years old. This is because the elderly are physically or economically vulnerable and live alone. Theft from Motor Vehicle – Grand experienced a similar spike in 2014, rising to around 46. Most of the other crime types stay relatively consistent, especially from years 2020 to 2022. The most interesting change in this graph is how victims of Burglary have decreased significantly in 2023. After further analysis, the drop can be attributed to a 62% decrease in Burglary incidents during that year. This decrease likely impacted the most common age group for Burglary victims since fewer burglaries overall can make young people who aren’t typically victims of Burglary more prominent in the data.
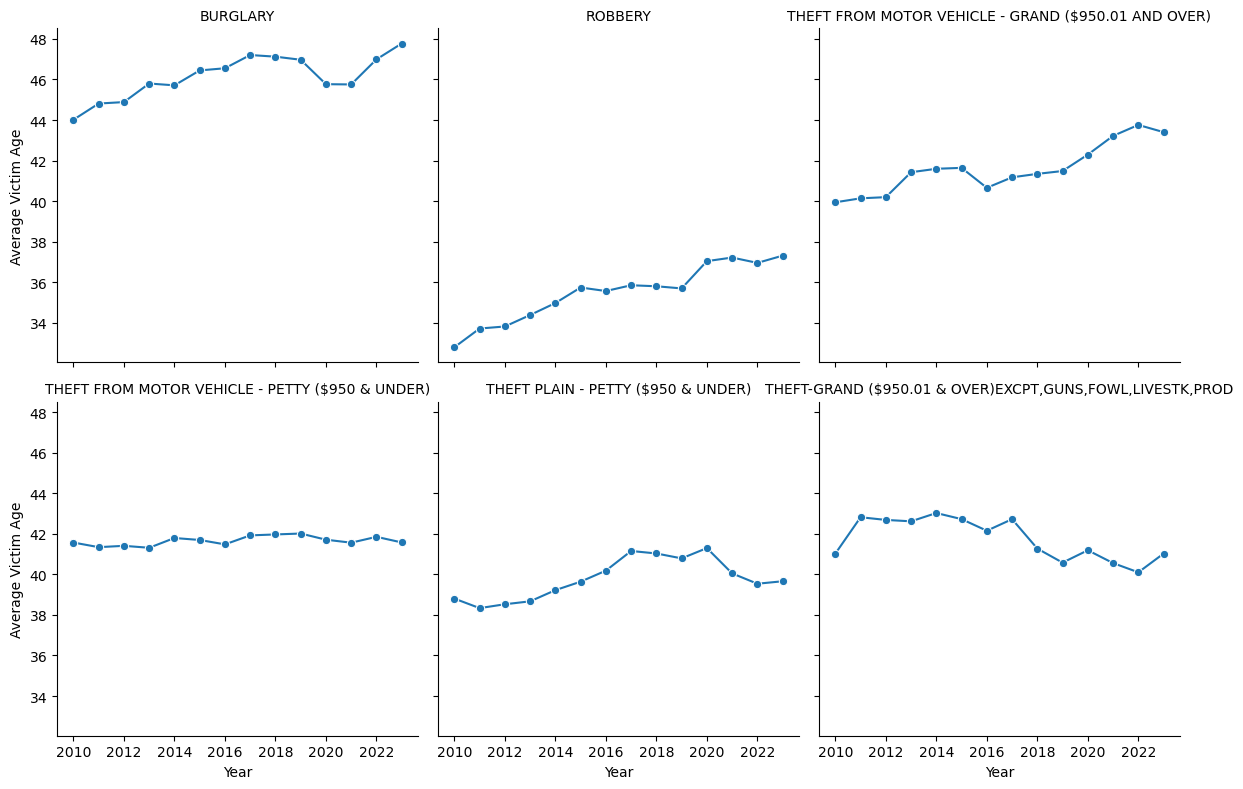
These line graphs plot the average age of victims for each theft type throughout the years. In this graph, we can observe that victims of Robbery are the youngest, sitting at around ages 33-38. Burglary, however, has the oldest average victim age at 44-48 which makes sense because the elderly are vulnerable in their homes and live isolated. The remaining types – Theft from Motor Vehicle – Grand and Theft from Motor Vehicle – Petty as well as Grand and Petty Theft – remain mostly consistent in the middle, around ages 39-43. This was interesting because we hypothesized that Robbery would be committed onto more older, elderly people because of their physical vulnerability. This could be explained since Robbery may be committed onto younger adults because they tend to work at places likely to get robbed such as gas stations.
General Overview
Our analysis of the graphs uncovered unexpected and interesting trends. When analyzing the victim count along with age, we expected older victims to have a higher theft count due to the elderly being more vulnerable. Instead, younger people around their late 20s contained the highest theft count. Another unexpected trend we found from our analysis of the most common age for each theft type throughout the years was that the most common age for Burglary suddenly dropped during 2023. During our analysis of comparing the average age of victims for each theft type throughout the years, Burglary was at its peak during 2023 despite the average age being around 47 and the most common age during that year being 20. This was interesting because the average age should also have dropped if the most common age of victims had dropped to 20, but instead, the average age was the highest for 2023.
Gender of Victim
This bar graph compares the gender of theft victims to each theft type. We compared both genders by calculating the percentage of victims for each crime type out of the total number of victims to obtain more accurate results. Burglary, Theft from Motor Vehicle, and Grand Theft do not contain much of a difference, likely because gender does not affect these types of crime and usually does not involve interacting with other people. The most notable observations of this graph were that Robbery and Petty Theft have a significant percentage difference. Petty Theft is committed more onto females while Robbery is committed more toward males. Females may be victims of Petty Theft more than males because Petty Theft does not involve violence, so individuals may go for targets less likely to resist. This leads to thieves going for females, who are often stereotyped as being less confrontational or physically less imposing. Robbery, being a more violent form of theft, may be more commonly committed against males because they are more likely to be in higher-risk environments, such as late-night hours after work or areas associated with gambling.
Geographic Theft Distribution
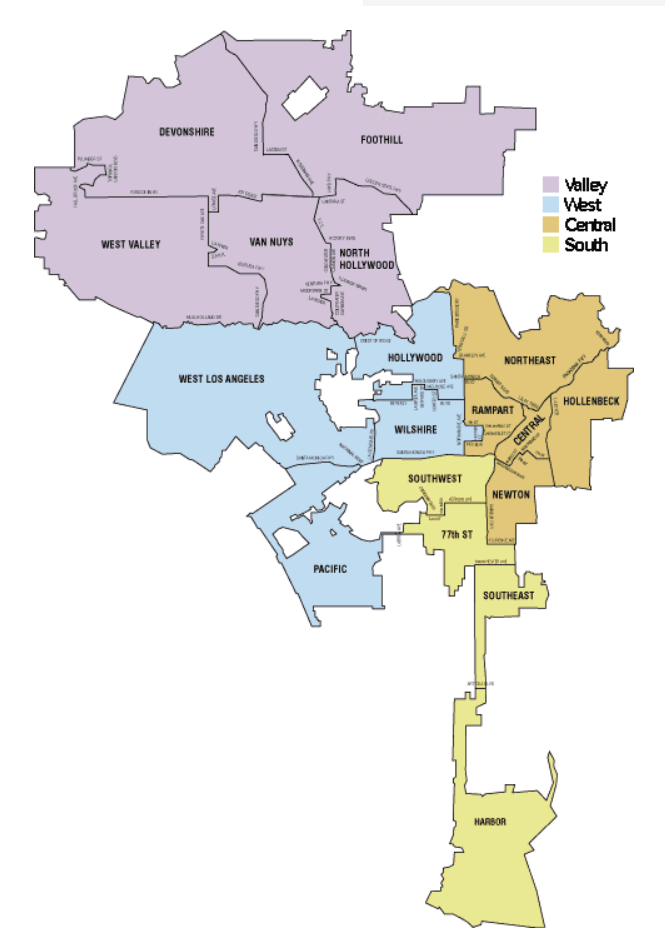
The next few graphs will focus on and analyze the location of theft instances. The graphs will analyze the areas around 21 Community Police Stations referred to as Geographic Areas. Geographical Areas are named after specific landmarks or communities the Police Station serves. For instance, the Geographical Area 77th Street contains a Community Police station located at 77th Street.
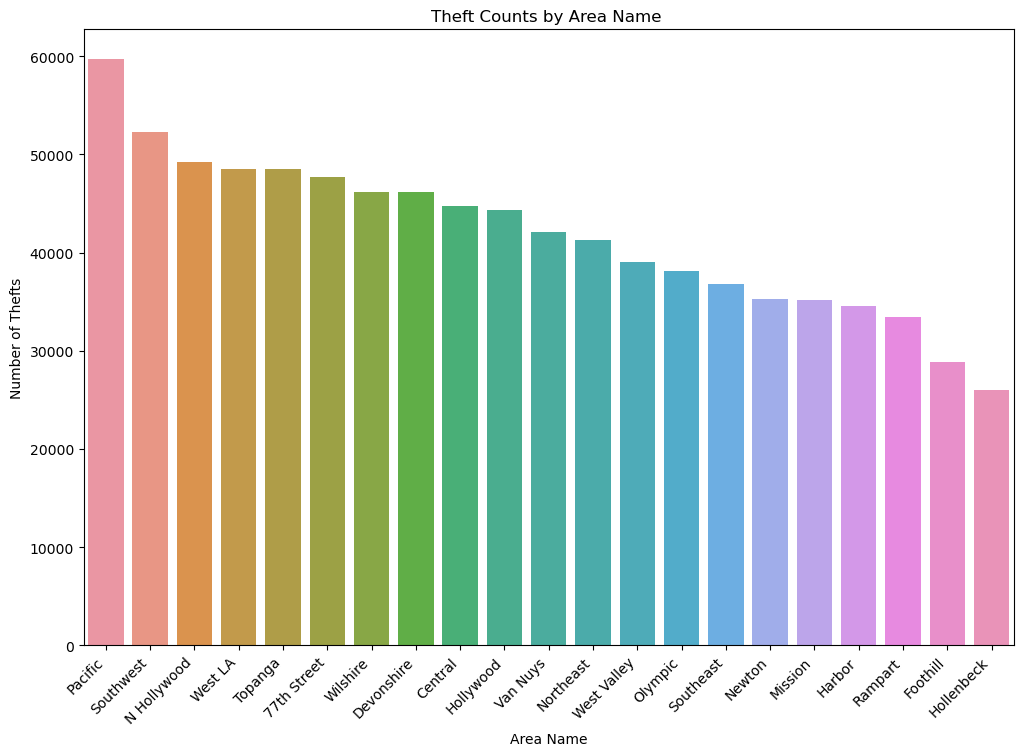
To analyze the theft counts for each Geographical Area, we compared the number of theft incidences for each area with a bar graph. Other than Pacific holding the highest theft count as opposed to other areas, there are not any substantial changes in the amounts of theft in each area – there are no heavy spikes or drops in certain areas. Upon further analysis, the Pacific geographical area includes the neighborhood of Westchester, which is home to Los Angeles International Airport (LAX), the largest airport in the region. This may explain the Pacific’s highest theft count despite its low population compared to other Geographical Areas, since most of the crimes there may be committed by people who arrive instead of the residents.
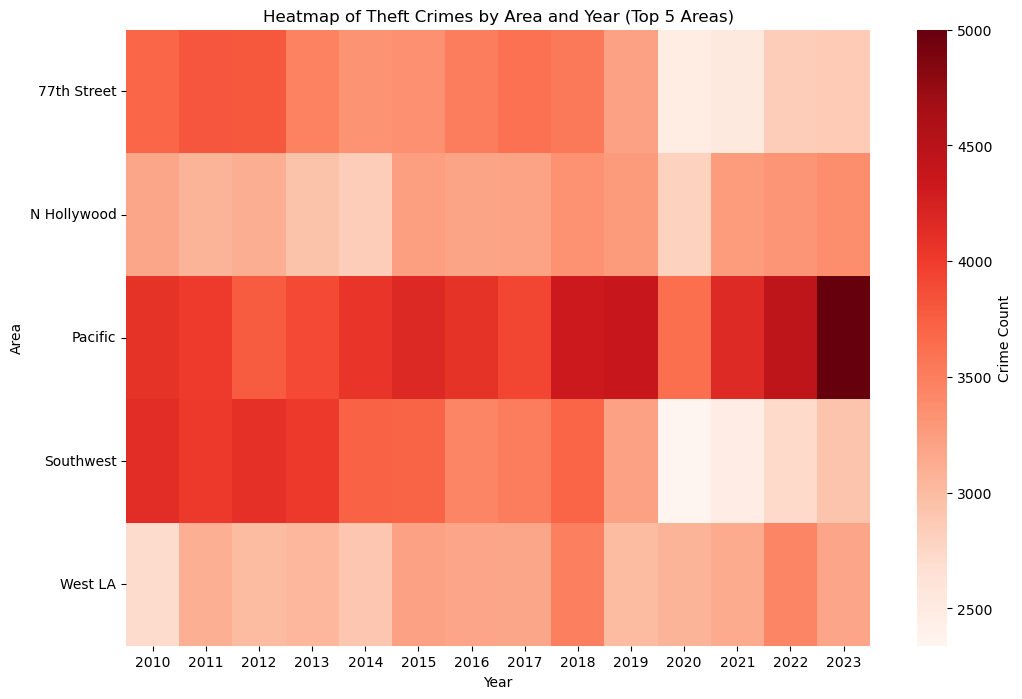
This heat map shows the number of theft crimes in the top 5 most theft-ridden areas over the years. The darker spots represent a higher theft count for that area and year. We can see that N Hollywood and West LA have stayed quite consistent over the years. Like the previous graph, Pacific has the highest theft count compared to other areas. Another observation was that during 2020, every area experienced a drop in crime amounts – likely due to the pandemic. After the 2020 decrease, the Pacific has a substantial increase in theft, rising to even higher levels than before the 2020 drop. After this drop, the theft counts steadily increased as the pandemic became less severe.
General Overview
From analyzing both of the graphs, we found very interesting trends. Our bar graph that compared the theft counts among the Geographical Areas showed Pacific containing the most theft cases. Further analysis showed that Pacific has a low population compared to other Geographical Areas, yet holds the highest theft count. We attributed this to LAX being located in that Geographical Area so the residents may not commit those theft incidents. Pacific is also shown to contain the highest theft count in the heat map. An interesting trend in the heat map is that the effects of COVID-19 are shown. Most Geographical areas have a significant decrease in theft count during 2020. Theft counts seem to return to pre-pandemic levels as Covid ends.
Temporal Patterns of Theft
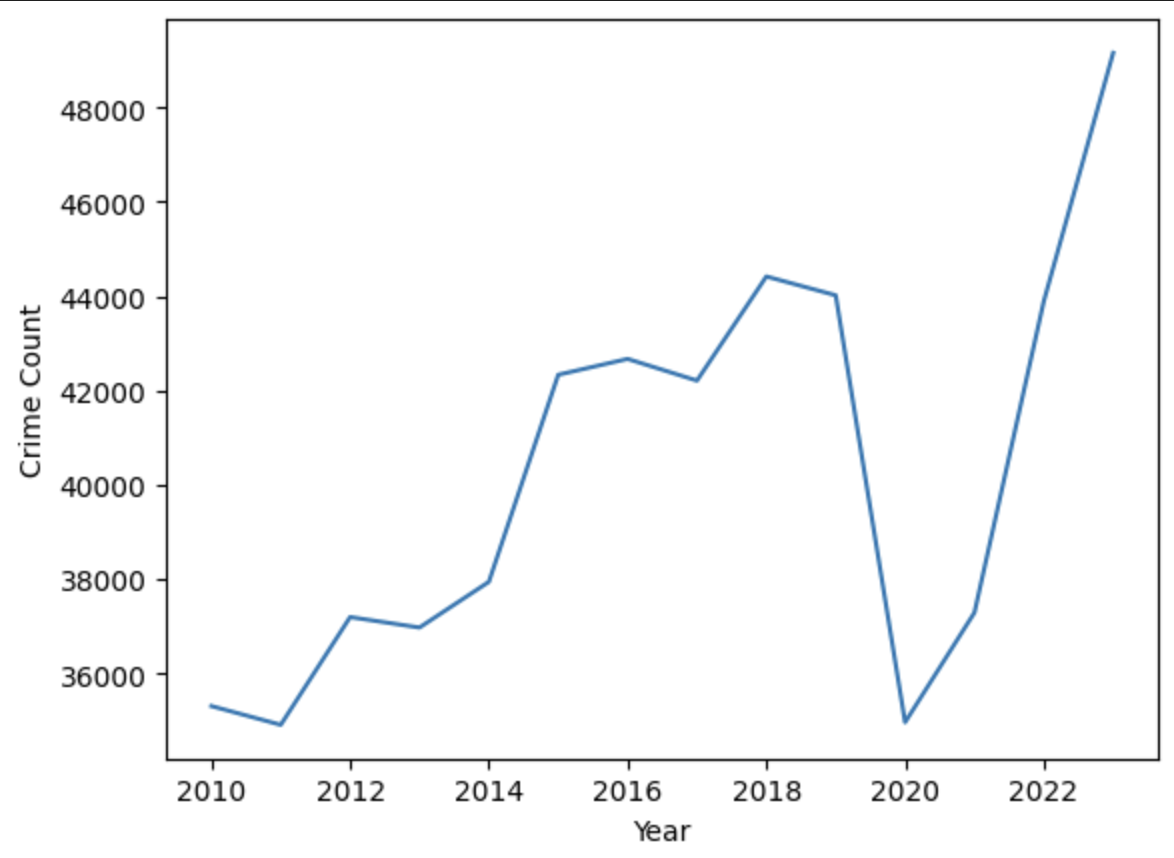
We will now focus on patterns of theft over the years. This simple line graph shows how the theft count changes through the years 2010 – 2023. We can see here that from 2012 to 2018 there was a steady rise in crime counts, noticeably spiking in 2015. However, in 2020 there is a substantial drop in crimes during 2020, dropping to levels similar to around 2010-2011. This is likely due to the COVID-19 pandemic; theft is notably more difficult when everyone is in quarantine. A very interesting trend is how this drop is followed by a dramatic surge in crime levels, rising even higher than it was previously, which may reflect a post-pandemic rebound that may be caused by economic instability or lack of reinforcement.
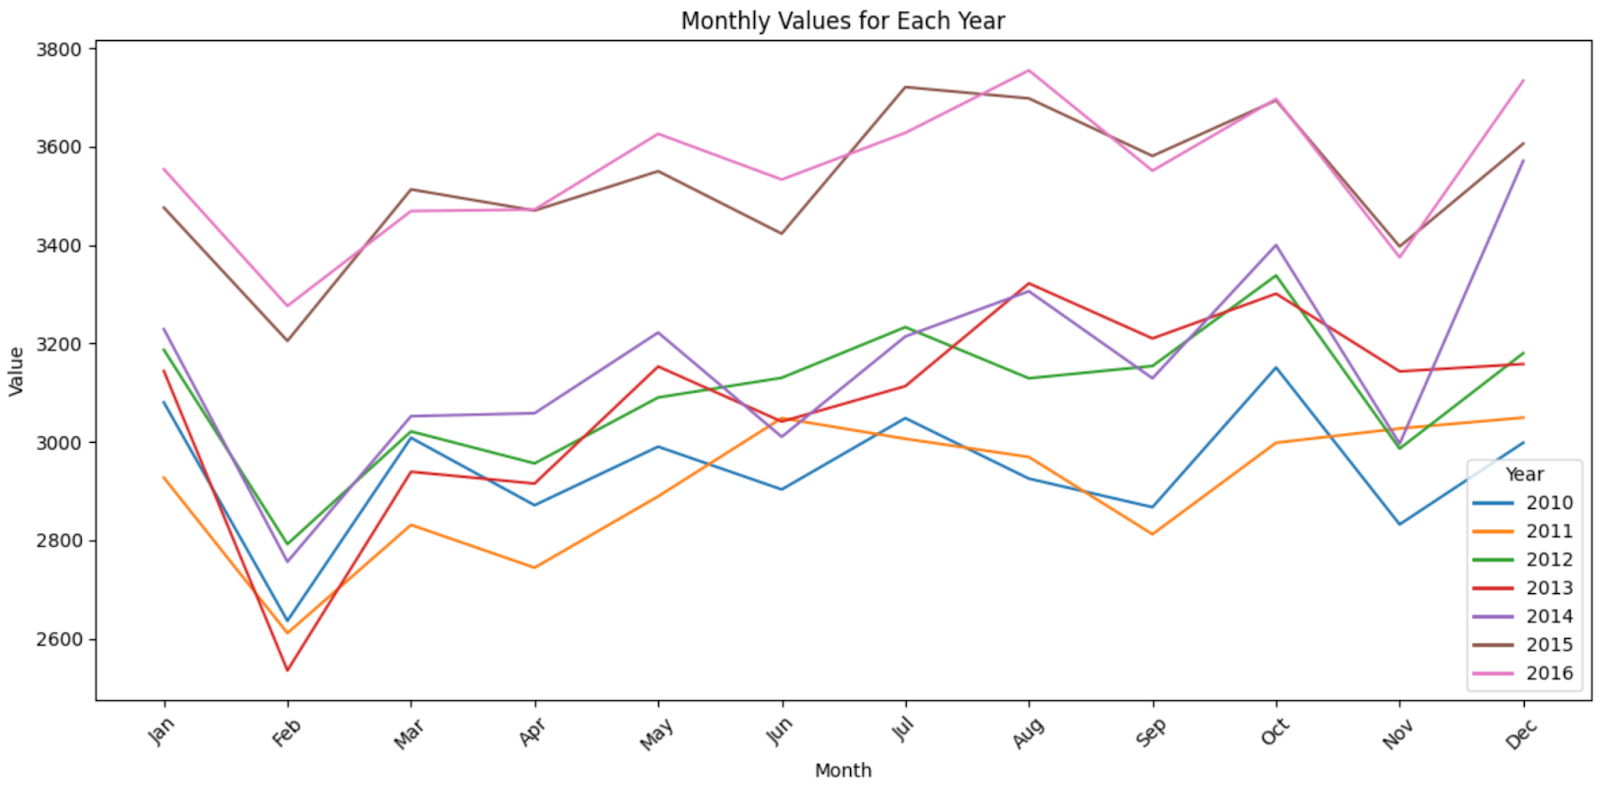
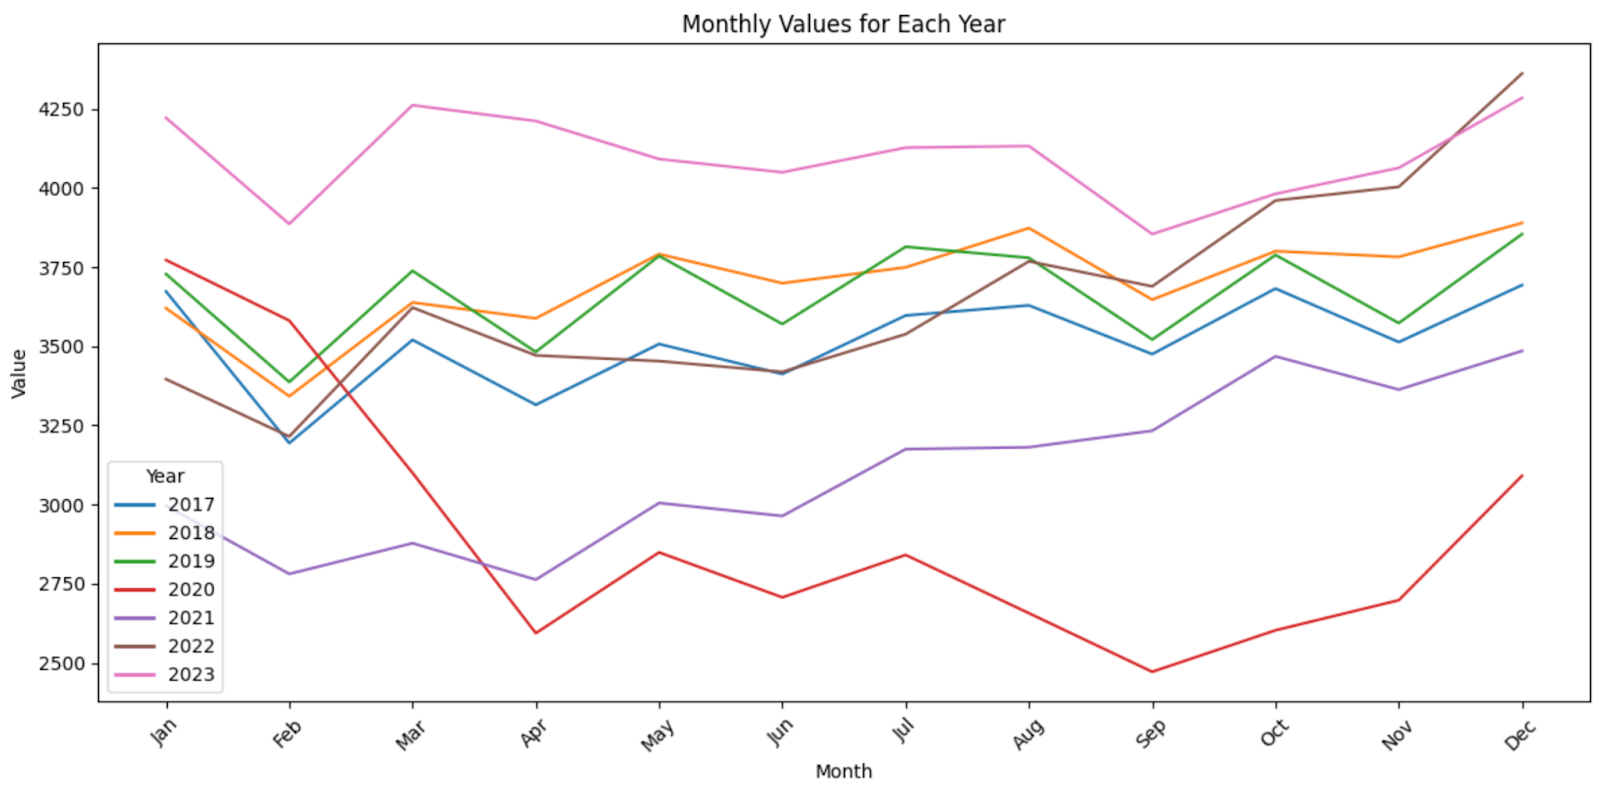
These line graphs focus on theft incidences throughout each month of the year. One noticeable trend seen here is that from 2010 to 2016 on the first graph, we can see that there is a significant drop in every year in February, yet it recovers to previous levels shortly after. It would seem that February is not a popular month for theft. We can also see in the first graph that 2015 and 2016 have the highest crime rates, especially from June to October. In the second graph, we can see the decreasing effects of the pandemic during April 2020 which was also seen in the previous graphs, followed by the steady increase in 2021-2023. Overall, crime rates seem to rise noticeably around the end of the year, especially in December, possibly from end-of-year holidays like Christmas.
General Overview
One of the consistent patterns we noticed when observing temporal patterns of theft was the 2020 drop. Likely due to the Covid 19 pandemic, theft cases decrease significantly around the year 2020. When everyone is in quarantine, theft becomes much more difficult. However, another recurring pattern is a substantial rise after 2020. After people are released from their homes, theft cases skyrocket. Possibly due to economic instability or other post-pandemic issues, theft cases rise even higher than they were before the pandemic. Another pattern we noticed was a February drop. In nearly every year, February seemed to have significantly fewer crimes compared to other months. On the other hand, December and other late-year months seem to have more theft than the other months. According to these patterns, theft is likely to continue to rise in the future.
Conclusion
During our analysis of theft rates using the LAPD OpenData’s crime records, we uncovered many interesting trends. Our analysis was based on comparing many aspects of these theft cases, such as the age of the victims, type of theft committed, date and location as well as many other factors. We got to analyze trends focusing on six types of theft; Burglary, Robbery, Theft from Motor Vehicle – Petty, Theft from Motor Vehicle – Grand, Petty Theft, and Grand Theft. Our analysis was also split between four sections. These were: “Age of Victim” which focused on the victim’s age, “Gender of Victim” focusing on the victim’s gender, “Geographic Theft Distribution” where we analyzed the location of theft, and “Temporal Patterns of Theft” where we analyzed theft trends over years/months.
Throughout our analysis, there were many interesting trends drawn from our findings. Young adults around the age of 20 are the most prone to being a victim of theft, and this becomes less likely for older people. Young adults not only are more prone to theft but also prone to more severe types of theft such as Robbery. In instances of less serious crimes such as Petty Theft, Females are more targeted instead of Males. When analyzing Geographical Areas Pacfifc has the highest count compared to other areas, despite its low population. Our analysis also shows the effect of COVID-19 over the years, since 2020 theft rates have dropped significantly. We also found out February is the least popular month for theft since throughout all the years theft rates drop during that month.
Overall, our article reflects the traits that victims of theft commonly share but also covers the rising issue of theft crimes in Los Angeles. Observing the specific types of people that are affected by theft crimes could help with the ever-rising theft cases. By analyzing these trends we can determine what aspects of a person or what location will affect the likelihood of being a victim of theft. To end our analysis, these trends revealed unexpected patterns and showed aspects of these theft cases that affect these incidents.


")
")