2022년 여름방학 고교생 대상 프로그램으로 중앙일보는 데이터분석 비영리 전문기관인 소다비 (SoDAVi, Social Data Analysis and Visualization, sodavi.org)와 공동으로 ‘2022 Python with Data Science Summer project’를 개최했습니다.
참가자 중 선발된 우수 학생에게 특전으로 제공한 ‘KD Data Journalist Internship‘을 캠프 종료 이후 약 3개월 간 진행했습니다.
학업에 바쁜 와중에도 마무리한 인턴십 결과물을 소개합니다. 2023년 여름방학에 캠프와 인턴십 프로그램을 개최할 예정이니 많은 참여 부탁 드립니다.
Quality of Life
[Professor] Seon-Ho Kim (Associate Director at the IMSC at the USC/SoDAVi CEO)
[leader] Joshua Kim (McCallie School)
Jeffrey Keem (Sunny Hills HS, G12)
Daniel Han (North Hollywood HS, G12)
Minjae Kim (Burank HS, G10)

.
Quality of life is a very subjective concept, one that can take on a multitude of definitions. To some people, quality of life can mean how much money they make. To others, quality of life can mean how secure their neighborhood is. Overall, it serves as an umbrella term to describe happiness according to different factors that control everyday life. The World Health Organization (WHO) defines it as an individual’s perception of their position in life in the context of the culture and value systems in which they live and in relation to their goals, expectations, standards, and concerns. Some of these components outlined by WHO are provided for in the countries in which people live. For example, the United States Constitutional Amendments grant rights to Americans, and the British National Health Service grants healthcare coverage to the British. These aspects listed are specific to each respective country. If the quality of life declines in a government, it can lead to political backlash, coups, and even wars, as seen throughout both current events and history, such as the list of grievances in America’s Declaration of Independence that highlight King George III’s violation of taxation, self-government, and fundamental human rights. Because the quality of life was unsatisfactory, the thirteen American colonies revolted against the British Empire. Although it depends on the individual, the quality of life in a country or region is often a prominent factor in immigration. If someone believes that another region has a better quality of life than the one he is currently living in, there is a reason to immigrate. (This plays a role in the varying immigration rates in different countries.) Ultimately, the adverse effects above can be prevented by governments if the well-being of their citizens is a priority. Analyzing these concepts is crucial because they can shed light on the areas that each government or individual can focus on and improve through policies, organization groups, or factions. Promoting the normalization of resources on ameliorating living conditions can take us closer to global success.
While doing our basic research, we first took notice of the strong correlation between health and quality of life. This is why we chose to dive deeper into their relationship—a health-focused definition of quality of life. Whereas U.S. News ranks 85 countries on the quality of life based on their own ranking system (they derived their ranking from an equally-weighted average of scores: affordability, healthy job market, economic stability, family-friendliness, income equality, political stability, well-developed public education, health system, and safety), we took a slightly different approach. Rather than these broad topics, we ranked countries on publicly available data, utilizing: self-reported health, life expectancy, infant mortality rate, deaths from cancer, suicide rates, social support, potential years of life lost, the overweight or obese population, and pharmaceutical spending sourced from the Organisation for Economic Co-operation and Development (OECD) to score each country’s quality of life. For measures such as self-reported health and life expectancy, we quantified the values and ranked them on a scale of 0-100. We adjusted the scale to account for unfavorable aspects such as infant mortality rates, obesity, and suicide rates by reversing the scale to maintain corresponding ratings. We accounted for countries with any missing data in our ranking. For countries with any missing data, we replaced it with the average of each measure instead of excluding such countries for analysis.
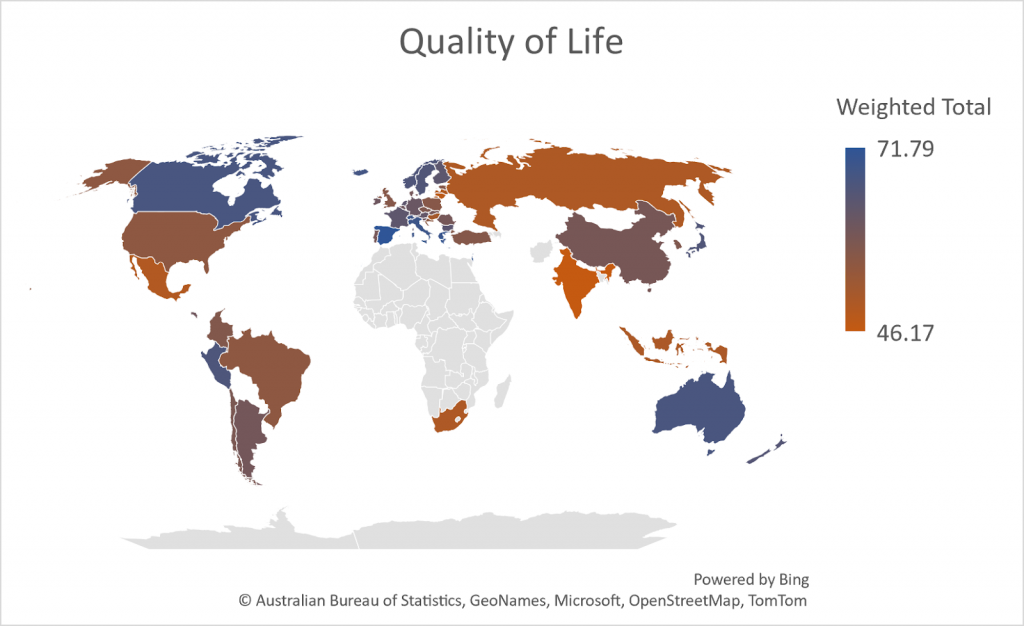
For our ranking, we equally weighed the various standardized measures since we could not find any information to determine the relative importance of the measures we selected. Countries were ranked based on our team’s definition of quality of life. Overall, the 1st place is Spain, the 2nd place is Greece, and the 3rd place is Israel. The table and the map at the end of this article show the overall rankings of countries based on their quality of life weighted total score.
Spain shows relatively outstanding scores in all categories and is top-ranked.
The United States has decent scores in most categories but is relatively low in life expectancy even though its self-reported health score is one of the highest. A possible explanation could be that many Americans are optimistic but overconfident about their health and do not give their health enough regard. A privatized healthcare system may play a role in this, where individuals unable to afford or access insurance are placed in situations with a higher risk of physical danger and financial ruin. Roughly 8.6% of people in the U.S. are unable to access healthcare, and even for those who do have access, the coverage provided by insurers may not be complete in terms of costs with the cost of paying for insurance being pricey in and of itself.
South Korea is ranked 32 overall, which is a relatively low rank. South Korea has the lowest self-reported health score and the highest suicide rate (24.1 per 100,000 persons), which shows strong grounds for alarm and indicates that actions should be taken to address this issue. The lowest self-reported health score is surprising since South Korea is well-known for its good healthcare systems which may indicate a need for more study. A potential cause may be that self-reported health depends on their expectation, and Koreans have higher health expectations. Another very possible reason could be the high stigma against modern medical treatments, especially ones for mental health reasons, due to the deep-seated, traditional values that many people from Asian countries hold; this manifests itself in the fear of social judgment, especially in older generations owing to fear of what others may think if they or their child seek treatment from a psychologist. An additional factor that plays into the topic of mental health is the available social support systems. For our measurement purposes, social support is defined as the number of friends or family one can count on in times of trouble. The data that has been collected by researchers for this topic poses an interesting phenomenon—young patients believe to have greater social support compared to older ones. This is likely due to the trend of spreading mental health awareness and an overall higher acceptance of disabilities and personal matters.
Next, we took a look at the potential years of life lost which is a measure of preventable, premature deaths that occurred at younger ages. For this scale, the higher the number, the worse it is. Korea ranks 4th-best, coming behind Switzerland, Luxembourg, and Japan in 1st, 2nd, and 3rd respectively, and ahead of Israel, which is in 5th. The reasons for these high rankings are likely credited to Korea’s and other high-ranking countries’ healthcare systems, levels of education, lifestyle, and government policies. All of the top 5 countries boast strong healthcare systems (which prevent and treat early illnesses), quality educational institutions (which help inform citizens about healthy behaviors); robust lifestyles which include healthy diets and physical activity; and carefully considered government policies like subsidizing healthcare or supporting public infrastructure for the safety of their inhabitants.
Tying into healthy behaviors and lifestyle is the obesity levels of a country, which may be an indicator of many things, such as poor food quality, uniformed or uneducated public, impoverished areas or food deserts, or a lack of variety in foods. Countries in East Asia rank high for low obesity. Japan is 1st and Korea 2nd. This may be a positive consequence of the abundance of side dishes eaten, many of which often include fresh vegetables, fruits, and natural ingredients. These countries also include foods low in saturated fats, opting for meals that have unsaturated fats, such as vegetable oils and nuts. Countries ranking the highest in terms of obesity levels are Mexico (1st), the U.S. (2nd), and New Zealand (3rd). The high levels in these countries are possibly due to the high quantity of processed foods present in grocery stores and restaurants. These often lack essential nutrients and contain a lot of sugar and empty calories. The availability of fast food restaurants and lack of grocery stores or supermarkets may lead to a food desert, a place much isolated from fresh or healthy food options. They are commonly in poorer areas of a country where there is a lack of infrastructure to create markets for grocery stores or transportation to get to them.
Now, delving deeper into healthcare systems, we observed international patterns in pharmaceutical spending, covering of expenses for prescription and self-medication. Easy access to over-the-counter products are seen in both a positive and negative light. It could lead to higher rates of substance abuse and potential deaths or sickness caused by wrong dosages, but also allow for the quicker purchase of needed treatment like painkillers. One should also consider that easily accessible over-the-counter medicine decreases strain on healthcare systems, reduces costs for consumers, and lowers the risk of side effects coming with medicines that target a particular symptom. For these reasons and the purposes of our evaluation, higher pharmaceutical spending on prescriptions and self-medications will be ranked more favorably than in countries with lower spending. Note that this excludes pharmaceuticals used in hospitals. According to OECD, Korea ranks 13th and had 18.6% of its total health expenditures in pharmaceutical spending. The U.S., on the other hand, is ranked 36th and only spent 11.044% of total health expenditures on self-medication. The majority of the U.S. healthcare system’s expenses were for hospital care (roughly 32%), followed by physician and clinical services (approximately 20%), and other factors like long-term care in nursing homes (around 7%).
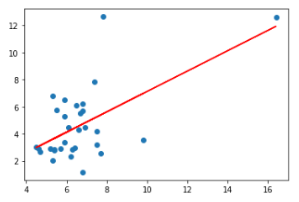
Furthermore, we looked at the quality of hospitals in those countries, such as health equipment in hospitals, and length of hospital stay. An abundance of hospital beds would likely hospitalize the patients efficiently, giving a positive effect on healthcare systems.To prove this point, we performed an analysis to find out whether the correlation between the number of days one stays in the hospital and the amount of beds exists. No correlation would’ve meant an abundance of beds would lead to a better flow of rooms and patients, which ultimately helps create a better health system, and since we didn’t find a factor that would cause people living in countries with enough beds to spend more time in the hospital. However, contradicting our expectations, those two factors showed quite a strong correlation, as shown in the regression plot. The X-axis shows the length of hospital stay, while the Y-axis expresses the number of hospital beds per 1000 inhabitants. It seemed pretty clear visually that the more beds exist, the longer one stays in the hospital. The correlation coefficient of this regression was 0.595, which indicated a positive relationship. Therefore, it is safe to say that the abundance of hospital beds doesn’t relate to a better hospital system, since the more beds there are, the longer the patients will stay. Going back to our ranking, our conclusion is reasonable. The two countries that rank high in hospital beds are Korea and Japan, but they are each ranked 30th and 23rd on the ranking, while Israel and Switzerland, our two top countries in their life, are ranked 22nd and 12th respectively.
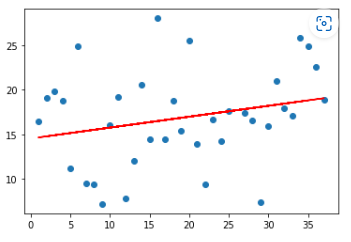
We also looked into smoking rates per country and how higher smoking rates correlate to worse quality of life. According to cancer.org, the reasons why people start smoking vary a lot. The main ones included peer pressure and stress relief to replenish energy when they are stressed. It is hard to say whether smoking starts from negative emotions, or if it starts from positive emotions. We thought if we could find whether smoking increased quality of life or if it decreased it, we could also conclude what kind of emotion starts smoking. We expected that negative emotions caused smoking, which meant smoking and quality of life rank would have a negative correlation since smoking doesn’t often lead to good. Again, contradicting our expectation, the regression plot showed a weak positive relationship as shown below. The X-axis of this plot was the quality of life rank we developed, while the Y-axis showed the percentage of smokers in corresponding countries aged 15 or above. As visually shown, the line of best fit is a weak, positive line, as the correlation coefficient is 0.247. From this graph, we found out that smoking actually leads to a slight improvement in quality of life. Going back to the causes of smoking, this result given is reasonable, since it is ‘slightly’ increasing. Going further, we were able to imply that the cause of smoking is slightly more of a positive emotion than a negative emotion.
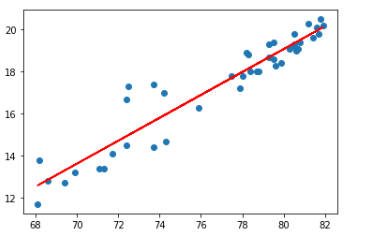
Life expectancy is the estimate of the average number of years that a person given an age can live. There is life expectancy at birth, which people normally refer to when mentioning `life expectancy’, but there is also life expectancy at a certain age. Longer life expectancy is normally derived from healthcare and the quality of a hospital, but also mental health and stress are part of it. We looked into life expectancy at birth, and life expectancy at the age of 65, to find hidden factors that affect those conditions. Like before, we did a regression analysis. Obviously, the X-axis being life expectancy at birth and the Y-axis being at the age of 65, the correlation was extremely high, as the correlation coefficient of 0.95 shows. This showed countries with better health and safety before their citizens became seniors did a better job at maintaining citizens’ health as they got old. However, we focused on the plots that were quite off the line, which were the four points circled. (Brazil, Colombia, Mexico, U.S.) These outliers were the countries that respectably had a longer life expectancy after the age of 65 than life expectancy at birth. In other words, people in those countries died at a young age, likely not because of an illness. According to worldlifeexpectancy.com, Brazil, Colombia, Mexico showed that one of their main causes of death was violence. The rate of death caused by violence was ranked top 20 in each of those countries, while death caused by diseases was around the top 100s. These statistics imply that the reason behind such a phenomenon is that although these countries were good at maintaining a healthy life, they failed to have a safe life, which can be linked back to our quality of life rank, where Mexico and Colombia were ranked 29th and 26th out of 37 samples. The United States was a bit different, as their rate of death caused by violence was 60th in the world, not a concerningly high level. However, they were ranked 1 in the rate of death caused by drugs, and this easily explained that U.S. people died due to drug overdose at a young age, emphasizing the need to solve this huge drug problem in this country. We then looked into Korea, to see what characteristics they had. The triangle point indicated Korea, which was above the line, implying early death. This was surprising, since Korea is a well known country for healthcare and low crime death rate, along with a relatively low death rate at infancy. This meant that these people were dying at the age of teen and adulthood, and those numbers were really high. We went back to the suicide rates that we analysis before, and found out that the reason korea’s plot was above the regression line was that it had high suicide rating.
This research aims to focus on the health-related aspects of quality of life, as there are numerous other factors that can be used to define this concept. We intended to study the United States and South Korea in particular, as well as countries that displayed any unique trends pertaining to our topic (this includes the top-ranked and bottom-ranked countries on the scale we created). Through our own scale, we utilized the countries’ self-reported health which held an equal weight as compared to the other components. Although we attempted to eradicate most of the external influences, this value could have factored in fields outside of our study. In countries with heavy political corruption and abnormal GDP, it is almost impossible to know how accurate the self-reported value is. On top of that, there were some empty cells in the dataset which could have skewed the data in assessing the country rankings. Our own scale also took into consideration the most recent year available on the open dataset from OECD. For example, the data for examining the potential years of life lost and pharmaceutical spending in 2020 meant that this was pulled during the Covid-19 Pandemic. Not only did some countries not report those numbers, but also the medical expenditure could have increased drastically on vaccine development and personal protective equipment, which could have boosted their overall country ranking. For future studies, it may prove to be a more accurate depiction to choose a year (preferrably the most recent data) that doesn’t have any atypical behavior in the health-related aspect (at least, in this project).
We defined our ‘quality of life’ not from any given from internet searching, but we made our own listing considering self-reported health, life expectancy, infant mortality rate, deaths from cancer, suicide rates, social support, potential years of life lost, the overweight or obese population, and pharmaceutical spending. We focused on the United States and Korea, which were each ranked relatively low, and countries with high quality of life rank to find out what we can derive from the data to suggest an increase in quality of life in both countries. Psychologically speaking, Korea was not one of the world’s brightest stars, showing high suicide rates despite living a high standard of life. The health factor of Koreans (suggested their ratings should be a lot higher, indicating low death toll at a young age and exceptional healthcare. Similar statistics showed that Japan, similar to Korea, had a high rating in health, despite having a lower rank in general. This was interesting, since many European countries, which were ranked high in health, but lower than these East Asian countries, had higher quality of life rank. This indicated that although healthcare somewhat contributed towards a better quality of life, there was another factor, a larger one, that affected their lives. Next, we looked at health habits, such as obesity and smoking. It was a common thought that obesity and smoking would lead to a negative impact on one’s quality of life. In terms of smoking, we were able to conclude that smoking actually didn’t correlate with a worse quality of life, but it actually had a positive effect, although it was small. From such information, we were able to infer that smoking might not be derived from bad emotions but actually derived from positive feelings. While looking more into life expectancy, we were able to find an interesting fact: countries that had high death rates from violence had a relatively low life expectancy from birth to the age of 65. In other words, people in these countries died at a comparatively young age, which ended up severely decreasing their quality of life.)
So what do all these rankings mean? While the health-dependent quality of life is only a small piece of the pie that makes up the overall conditions and factors of what one defines as a high standard of living, we decided to focus on a medical and bodily interpretation as we found it to be highly interconnected with the other parts of quality of life, such as social relationships and environment. Whether it be from interest, looking for a country to move to, or researching what areas your own country lacks, being knowledgeable of the problems or benefits that majorly affect lifestyle is important in an age where information is so freely available and widespread. Through this article, we intend to shed light on obscure or unknown information and make it more digestible for readers, and by doing this, we hope to spread awareness on some of the topics covered in the rankings like mental health or obesity rates. By broadcasting issues, we would like to inform readers about pressing issues like concerningly high depression rates and unhealthy levels of processed foods in a country or region’s diet. From this information, we hope to support change and reduce the stigma that follows these sensitive topics, allowing for the people struggling and those around them to come together and help develop a greater community.
| Quality of Life Rank | Country |
| 1 | Spain |
| 2 | Greece |
| 3 | Israel |
| 4 | Italy |
| 5 | Switzerland |
| 6 | Iceland |
| 7 | Canada |
| 8 | Australia |
| 9 | Peru |
| 10 | Norway |
| 11 | Sweden |
| 12 | Japan |
| 13 | New Zealand |
| 14 | Luxembourg |
| 15 | Bulgaria |
| 16 | Finland |
| 17 | France |
| 18 | Netherlands |
| 19 | Austria |
| 20 | Germany |
| 21 | Slovenia |
| 22 | Ireland |
| 23 | Belgium |
| 24 | Costa Rica |
| 25 | Argentina |
| 26 | Denmark |
| 27 | Slovak Republic |
| 28 | Romania |
| 29 | Portugal |
| 30 | China |
| 31 | Chile |
| 32 | South Korea |
| 33 | Czech Republic |
| 34 | Colombia |
| 35 | Estonia |
| 36 | Türkiye |
| 37 | United Kingdom |
| 38 | Poland |
| 39 | Croatia |
| 41 | United States |
| 42 | Hungary |
| 43 | Indonesia |
| 44 | South Africa |
| 45 | Russia |
| 46 | Latvia |
| 47 | Mexico |
| 48 | Lithuania |
| 49 | India |


")
")