By: James Kim, Howard Jung, Jaemin Kwak, and Jeremiah Chun (Under supervision of Minsang Yoo)
Introduction
For the past four months, our group has been working under USC Professor Seon Kim and his Korea Daily Data Science (KDDS) internship to uncover trends within the Korean American population. It is imperative that we recognize the data used in this project came from the United States Census Bureau dataset (https://data.census.gov/), and our conclusions are rooted in the trends provided by this dataset. What we hope readers take away from this article is a deeper understanding— one based in fact— of the Korean American population crisis, and what is to come of it in the following years.
General Overview
Simply put, within the Korean-American population, the younger generation is dwindling while the older generation is on the rise— meaning that as a whole, Korean Americans are aging. To figure out why that was happening, we decided to compile data from many different states but specifically focused on these five: California, New York, Texas, Virginia, and New Jersey. These five states contained the most amount of data in the dataset, allowing for much deeper findings.
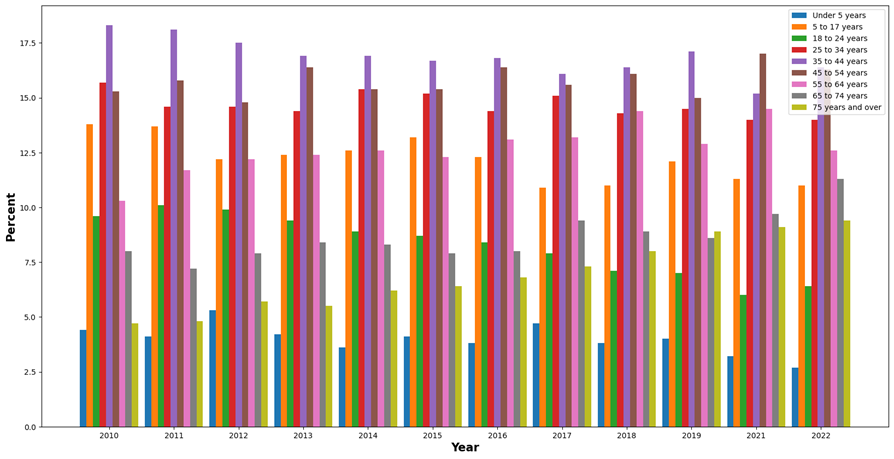
This bar plot represents data from California; however, is also representative of the other four states as they all showed a similar pattern. When analyzing the barplot, there is a clear trend that is shown: the amount of Korean Americans under the age of 45 years is on a steady decline, while there is a growing number of ages above it. In order to investigate this phenomenon further, we decided to look into the specific age ranges. This was done by utilizing linear regression to identify trends and also predict what will happen to the population as time goes on.
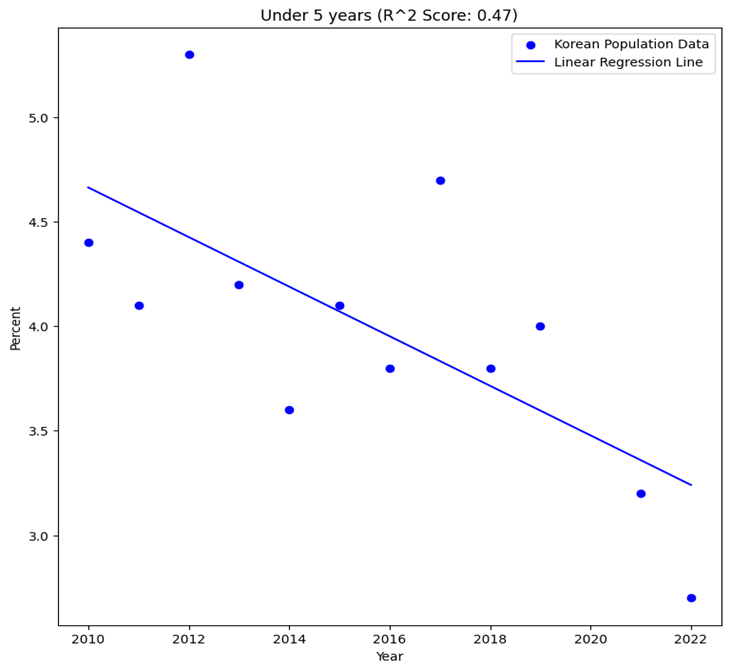
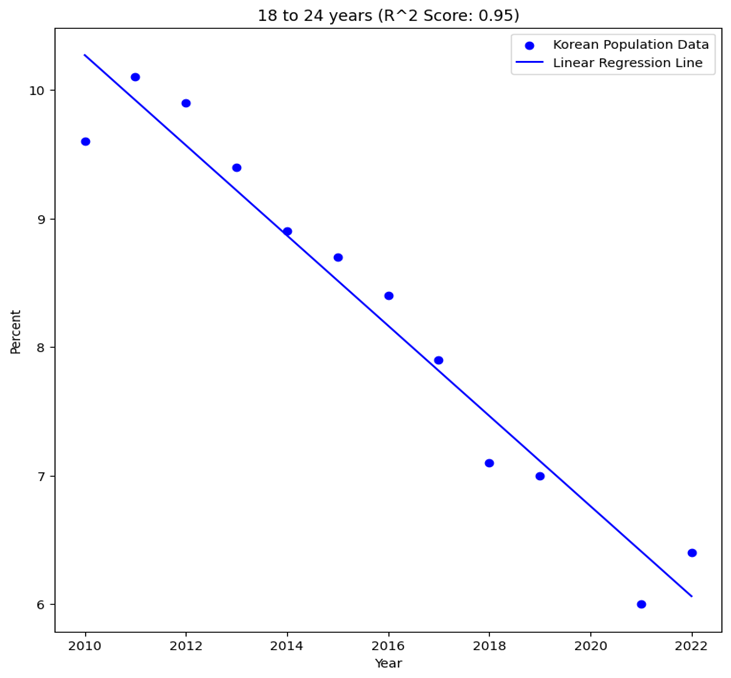
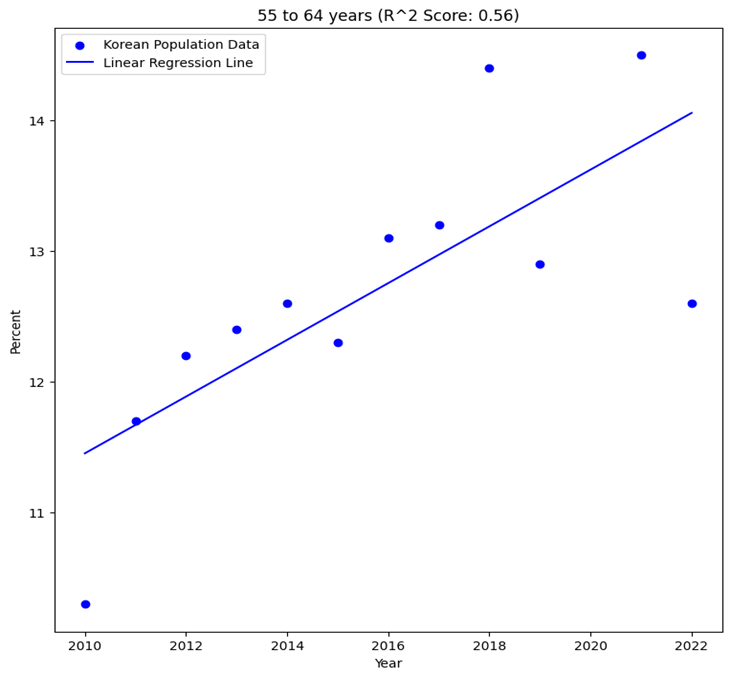
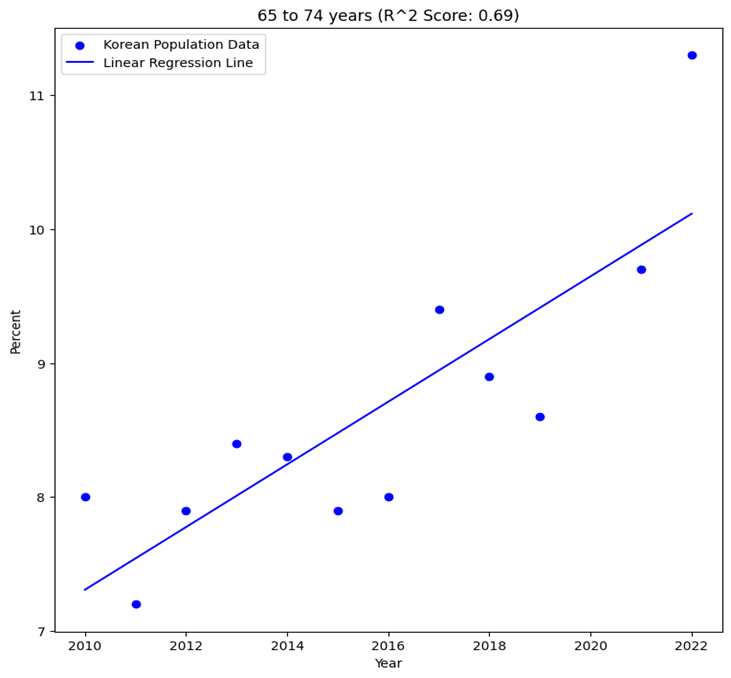
We found that these graphs supported the claim that Korean Americans are aging. This means that over the years, there have been fewer births annually in parallel with a consistent growth of the older populations. One conclusion to take away is that if these trends continue, at some point soon, the Korean American population will die out. One important discovery we found could be attributed to great bounds in fields such as technology and medicine, as thanks to these advances, older people, more specifically older Korean Americans have been able to survive longer. This explains why there has been such an increase in the older generations of Korean Americans; however, did not explain the shrinking younger population. While we could assume that Korean Americans were choosing to not have children, this assumption was not supported by any evidence. To find what may have led to these diminishing numbers in younger generations, a more in-depth analysis was needed.
In-Depth Reflection
Korean Americans are aging. Older Korean Americans are not being superseded by younger generations, whether it be the descendants of Korean migrants or those who directly immigrated at a young age. We found that states traditionally considered Korean American hotspots (California, New York, New Jersey) suffered the most from this aging compared to most states. Although other states (such as Texas, Virginia, etc.) have an aging Korean American population, these states notably have a growing population of working-age Korean Americans that is not as present in traditional Korean American states.
▶California
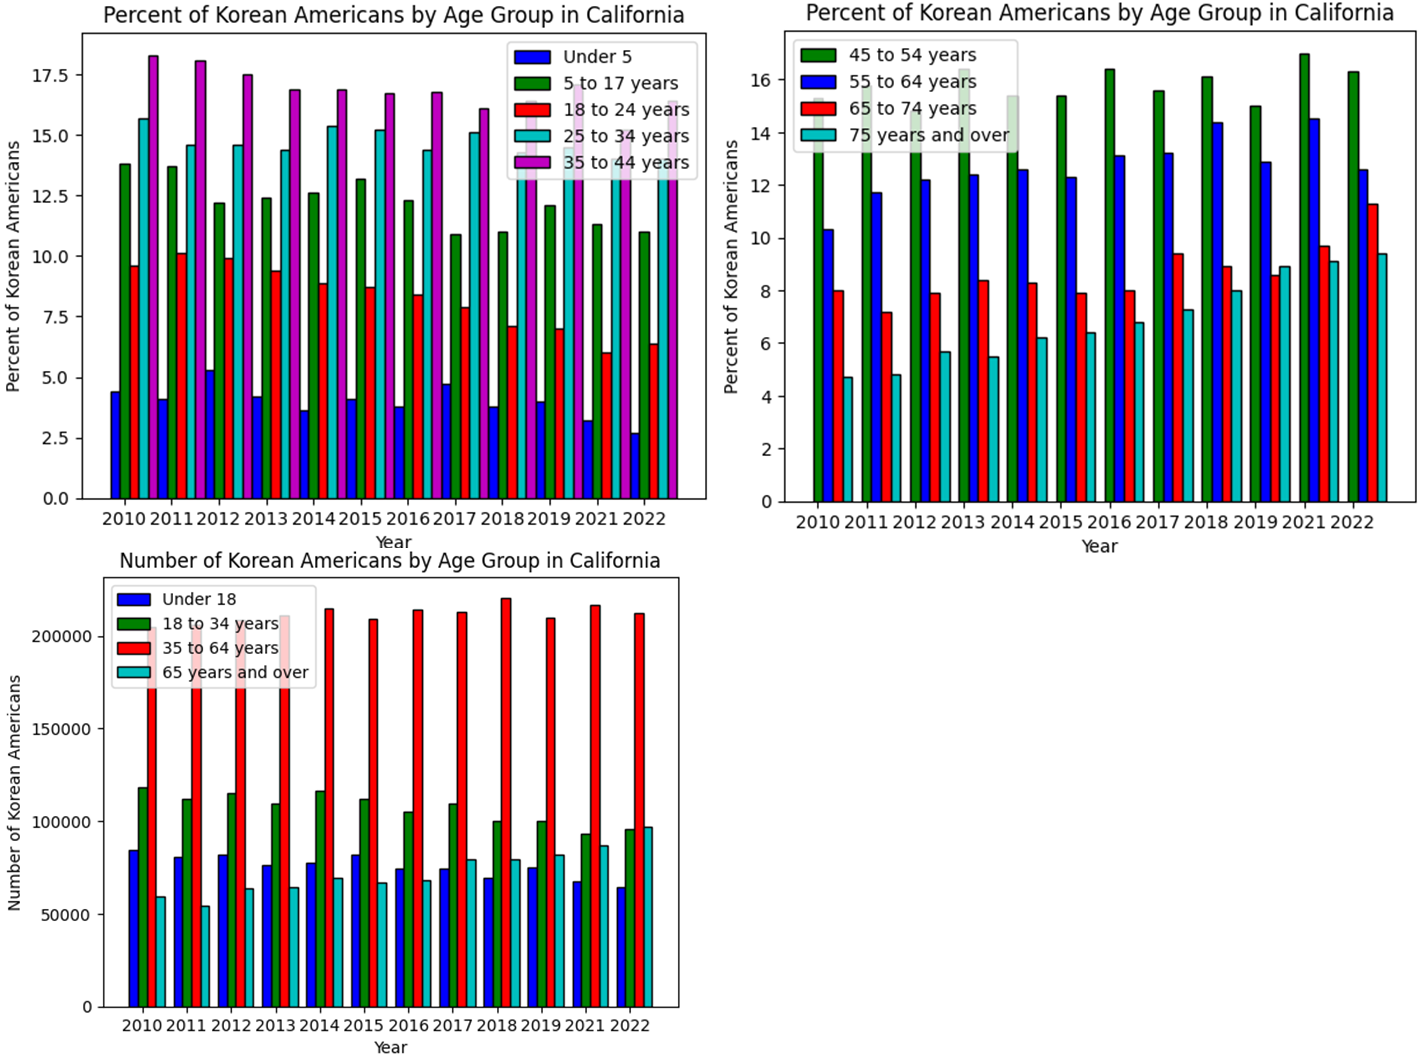
Known for hosting the Mecca of Korean American society, Korea Town, California’s Korean American population has undoubtedly been hit hard by population aging. In the oldest year that the Census dataset provides, the number of Korean Americans under 35 years old totaled 202,836, nearly 40% of the Korean Americans in California. Come 2022, that number has significantly fallen. Korean Americans under 35 years old only numbered 159,725, dropping to 34% of all Korean Americans in California. On the surface, these numbers may seem insignificant, but they confirm that the amount of young Korean Americans within California has been dropping, which is a strong indicator of population aging.
What’s left is to look at the older generations, or what we consider to be the elderly. In 2010, Korean Americans above 65 years old numbered 59,206, nearly 13% of the Korean Americans in California. In 2022 this number shot up to 96,854, an increase of 20.7%. This stark rise in comparison to the decrease in the younger generations demonstrates that elderly Korean Americans aren’t just aging, they are immigrating. The data shows that California has become a major hotspot for the immigration of elderly Korean Americans from other states and even Korea itself.
One question arises: “Why don’t young Korean Americans want to at least stay in the Golden State? Why do they want to leave the Bay?” To that, we say it could be due to rising job markets in other states. With Silicon Valley’s market declining, many big tech companies have looked elsewhere to set up shop. Simultaneously, California is no longer America’s startup workshop. That honor has shifted to Manhattan’s glowing Financial District and Chicago’s skyscrapers. This fleeting job market combined with the declining living standards in California may encourage Korean Americans to leave, as this demographic is typically known to be ambitious, hardworking, and pioneering.
▶New York
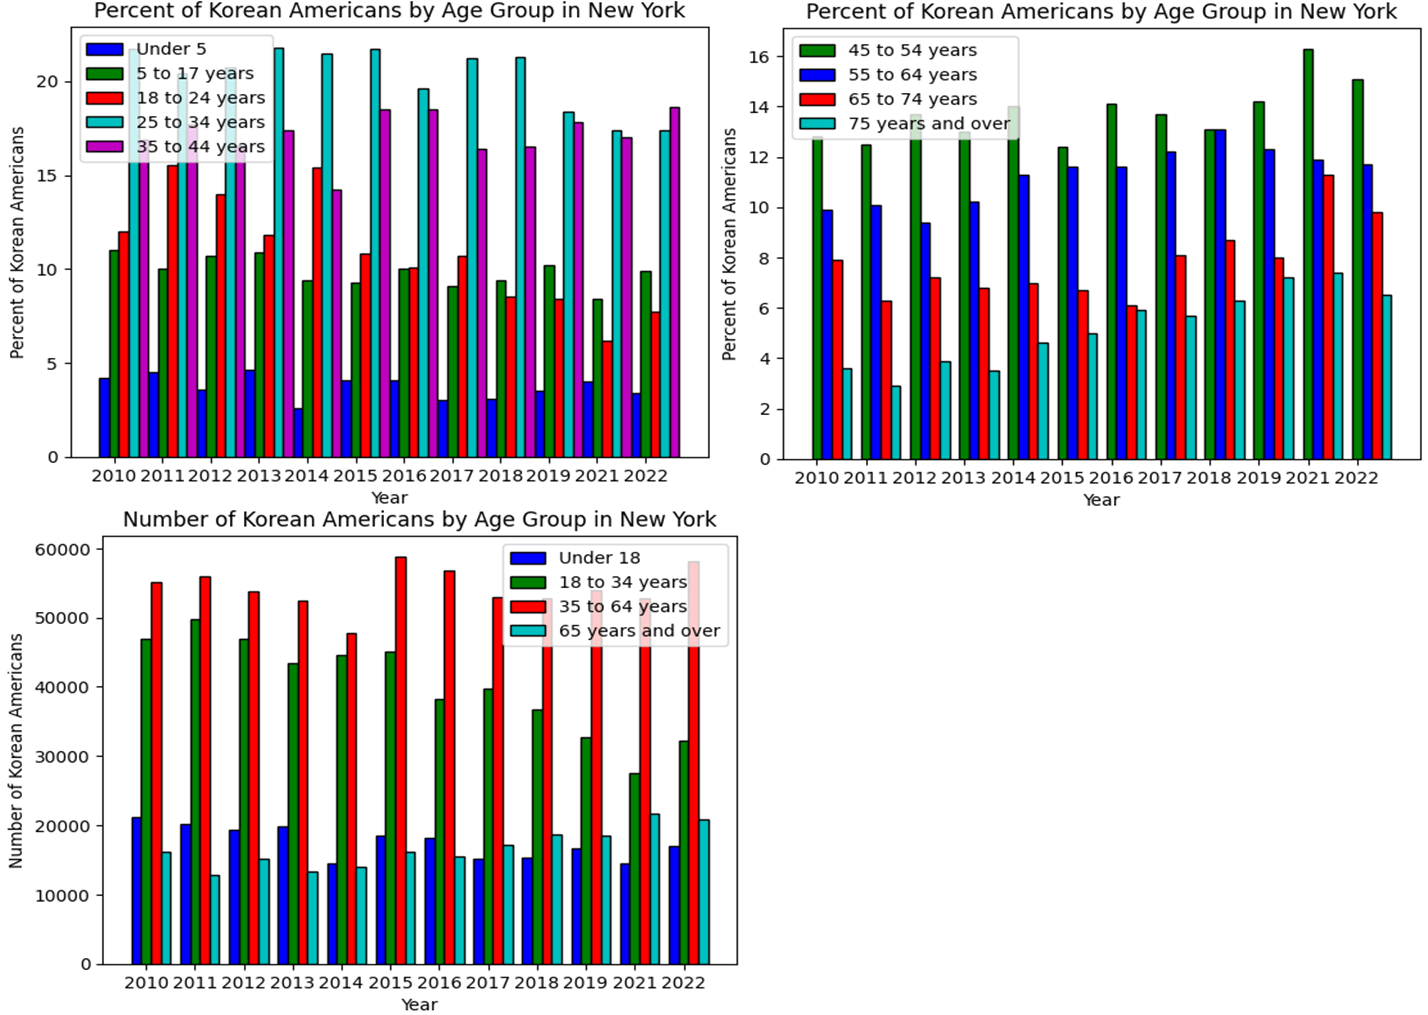
New York City, a city built on hopes and dreams of the Industrial Revolution and one that spearheaded America for centuries with its massive shipping and industrial base backed by the largest financial firms in the world. Combined with its cultural production of fashion, music, and sports, how could America’s diamond lose its luster? As it turns out, we can see clearly through a reflection of its Korean American population. In 2010, the count of Korean Americans under 35 stood at 68,132, making up 49% of the demographic in New York. By 2022, this figure had declined to 49,154, representing 38.4% of the community in the state. Conversely, Korean Americans above 65 years old witnessed an increase. Initially, there were 16,136 elderly Korean Americans in 2010, accounting for 11.5% of the population in New York. By 2022, this group had expanded to 20,865, now comprising 16.3% of the Korean American populace in New York. This demographic shift reveals that there is a trend of younger individuals decreasing while the elderly population increases, we found that this was an indicator of potential changes in the dynamics and needs of New York’s Korean American community.
Something worth noting, however, is that the trend has been reversing in recent years. Between 2021 and 2022, the age groups under 65 years old saw increases in population while the elderly population unexpectedly decreased. One possible explanation for this phenomenon could be due to the re-emergence of New York’s Financial District with rising companies such as Jane Street making their breakthroughs on the job market that year. These breakthroughs have attracted many working-class Korean Americans to relocate to New York. While this does explain what happened to the growth in the younger population, it doesn’t quite describe why the elderly population, which had been consistently on the rise in New York, had suddenly dipped that year.
▶New Jersey
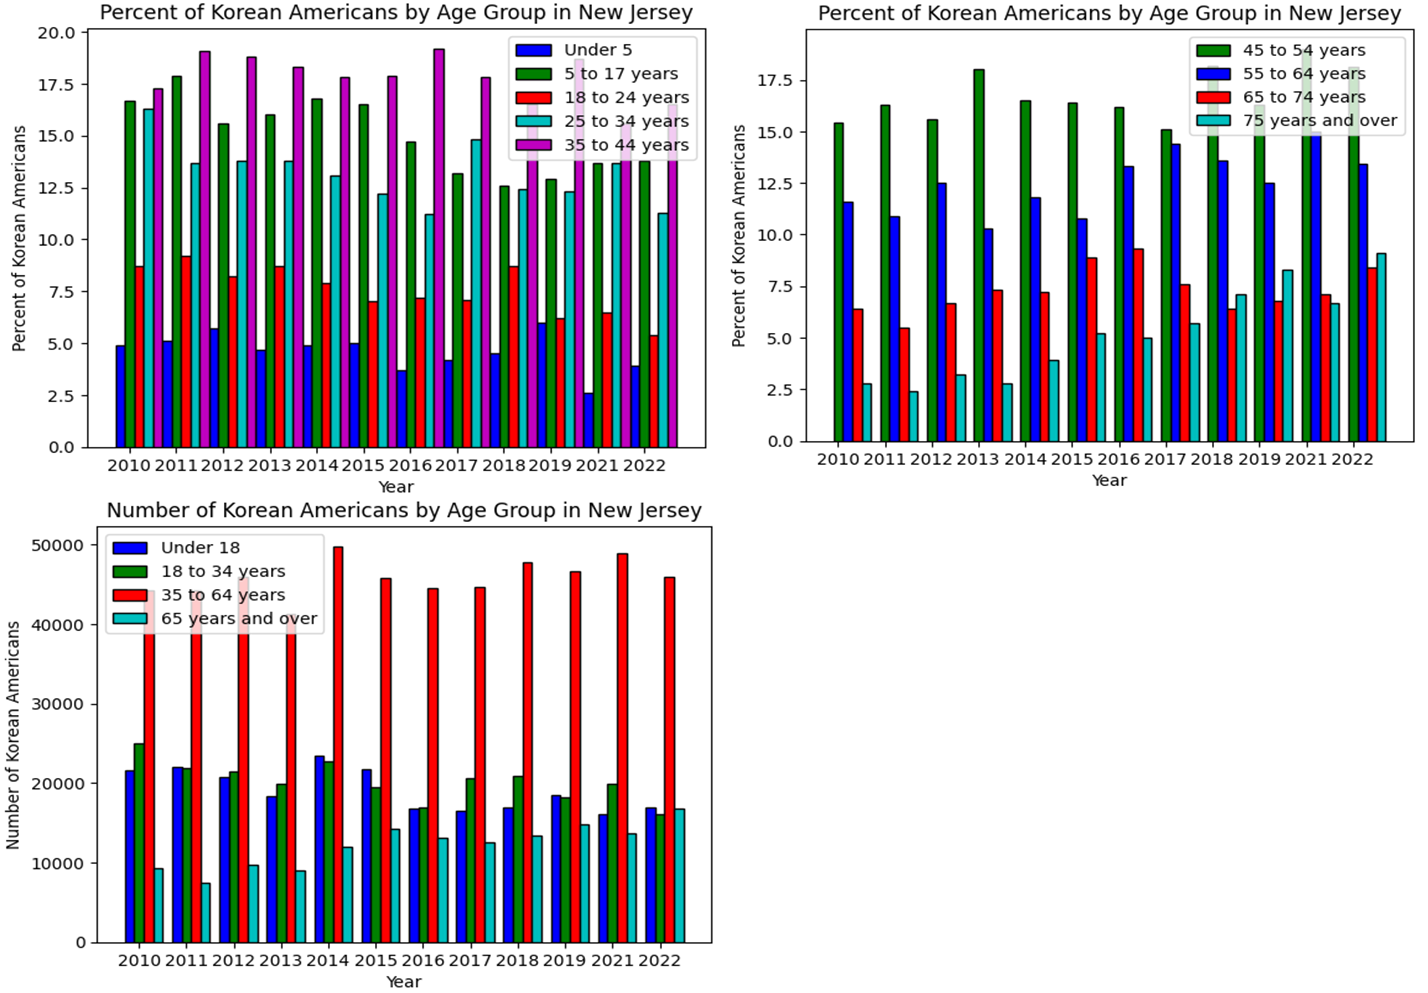
Similarly to California and New York, New Jersey holds similar trends. In 2010, the count of Korean Americans under 35 years old in New Jersey stood at 46,595, making up 46.6% of the demographic in the state. By 2022, this figure had decreased to 33,012, representing 34.4% of the community in New Jersey. Interestingly enough, the population of middle-class Korean Americans—aged 35 to 64 years old, encompassing those around the working age and approaching retirement—would rise between 2019 and 2022, only to drop. What this could imply is that New Jersey’s job market provided what could be considered more stable jobs for higher-level employees rather than entry-level, internships, or startup positions.
▶Texas
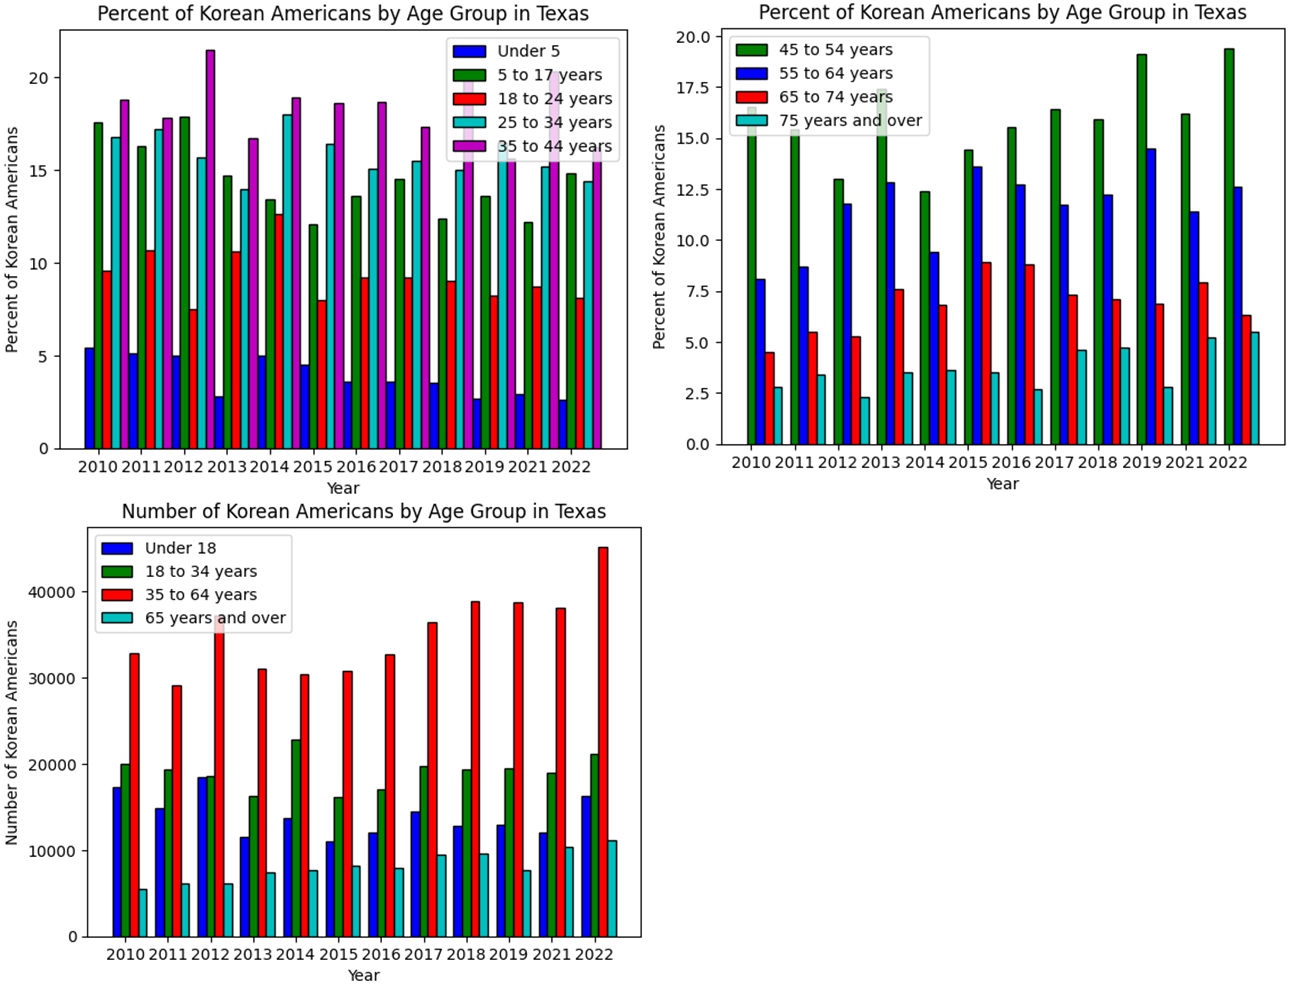
Everything’s bigger in Texas; the Korean American population being no exception. Unlike other states which either have a stagnant or decreasing total Korean American population, Texas has an increasing population. However, it’s important to know that Texas still has an aging one. In 2010, the count of Korean Americans under 18 was 17,355, comprising 23% of the demographic, a figure that decreased to 16,265, or 17.4%, by 2022. Conversely, the number of Korean Americans over 65 in 2010 stood at 5,499, representing 7.3% of the population, which would rise to 11,099, or 11.8%, in 2022. Again, though Texas does show signs of an aging Korean American population, it is on a much smaller scale than the previous states.
Most notably, Texas has an increasing population of working-age Korean Americans between 18-64 years old. In 2010, the count of Korean Americans aged 18-34 years was 19,938, and those aged 35-64 numbered 32,827, totaling 52,810. By 2022, these figures had risen to 21,113 for 18-34 and 45,201 for 35-64, amounting to a combined total of 66,314. What’s remarkable is that Texas maintains this consistent upward trend of an increasingly Korean American workforce. This could be the result of more established companies moving to Texas, and thus pulling jobs with them. We found that it may also be because Texas has a lower living cost compared to California or New York, attracting young, opportunistic Korean Americans. Lastly, we found that there is a possible shift as Korean Americans are moving away from traditionally liberal, Democratic states to Republican states because of lower living costs.
▶Virginia
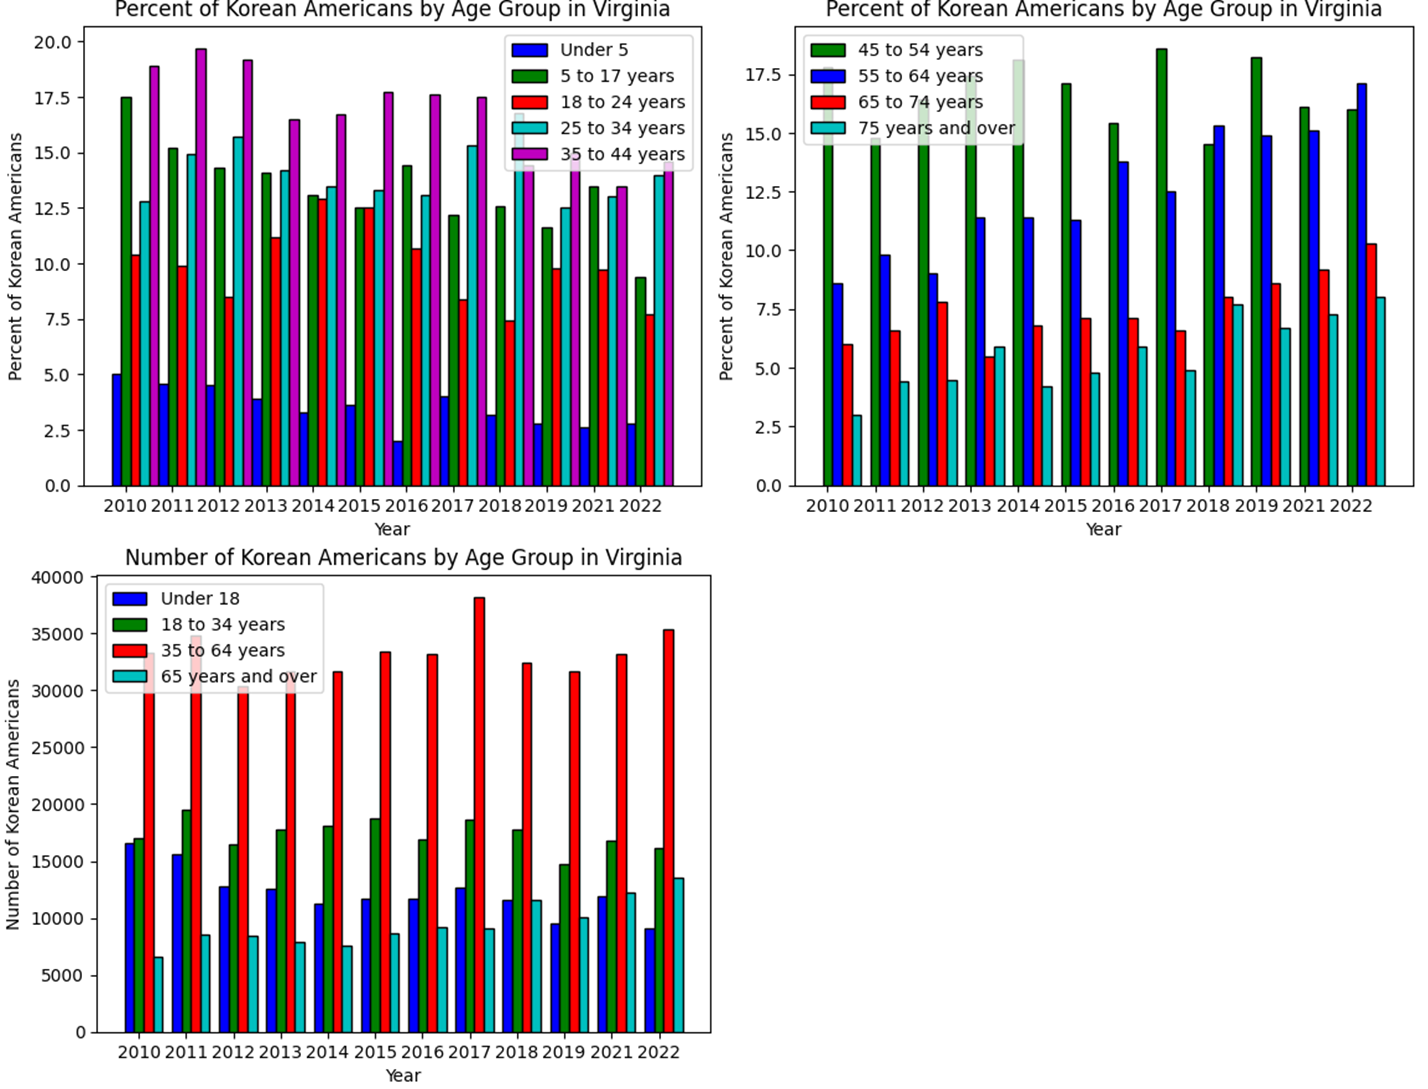
What our group found was that Virginia, in many ways, was quite similar to Texas; however, it still had key differences. In 2010, the population of individuals under 35 years old in Virginia stood at 33,565, comprising 45.7%, and would fall to 25,214, accounting for 33.9% by 2022. Concurrently, the population of Korean Americans above 65 years old in Virginia was 6,606, representing 9% in 2010, which would rise to 13,579, accounting for 18.3% by 2022. While the aging effect was worse than Texas’, it was not as harsh as other states.
Within the working class, it’s worth noting that the younger half, ages 35 to 44 years, decreased. The main contributor to the increasing size of the 35 to 64 age group was the 55 to 64 year age group. This group went from being 8.6% to 17.1% of the total Korean American population in Virginia. Although this statistic does indicate an aging effect, it is distinct from the one observed in California and New York. This age group is still able to work relative to the much more elderly population which has exploded in other states. This is similar to how New Jersey had an attraction towards workers approaching their twilight years.
As previously mentioned in the Texas section, Virginia is also a traditionally Republican state with a low cost of living. This low cost of operation also extends to businesses. The Virginia Economic Development Partnership reported that “…construction costs fall below the national average by 7% to 20%, depending on the region.” These low costs are extremely attractive to prospective businesses that want to keep costs low. These businesses bring jobs that attract potential workers with them, extending to foreign companies like those based in Korea. These companies that are looking to expand into the U.S. logically choose those states that have a higher ease of doing business. These Korean companies bring with them Korean workers and experts who then contribute to the KA population, particularly the 55-64 which is the age that most high-level company experts are at.
Graphical Analysis
▶Setting up Tableau
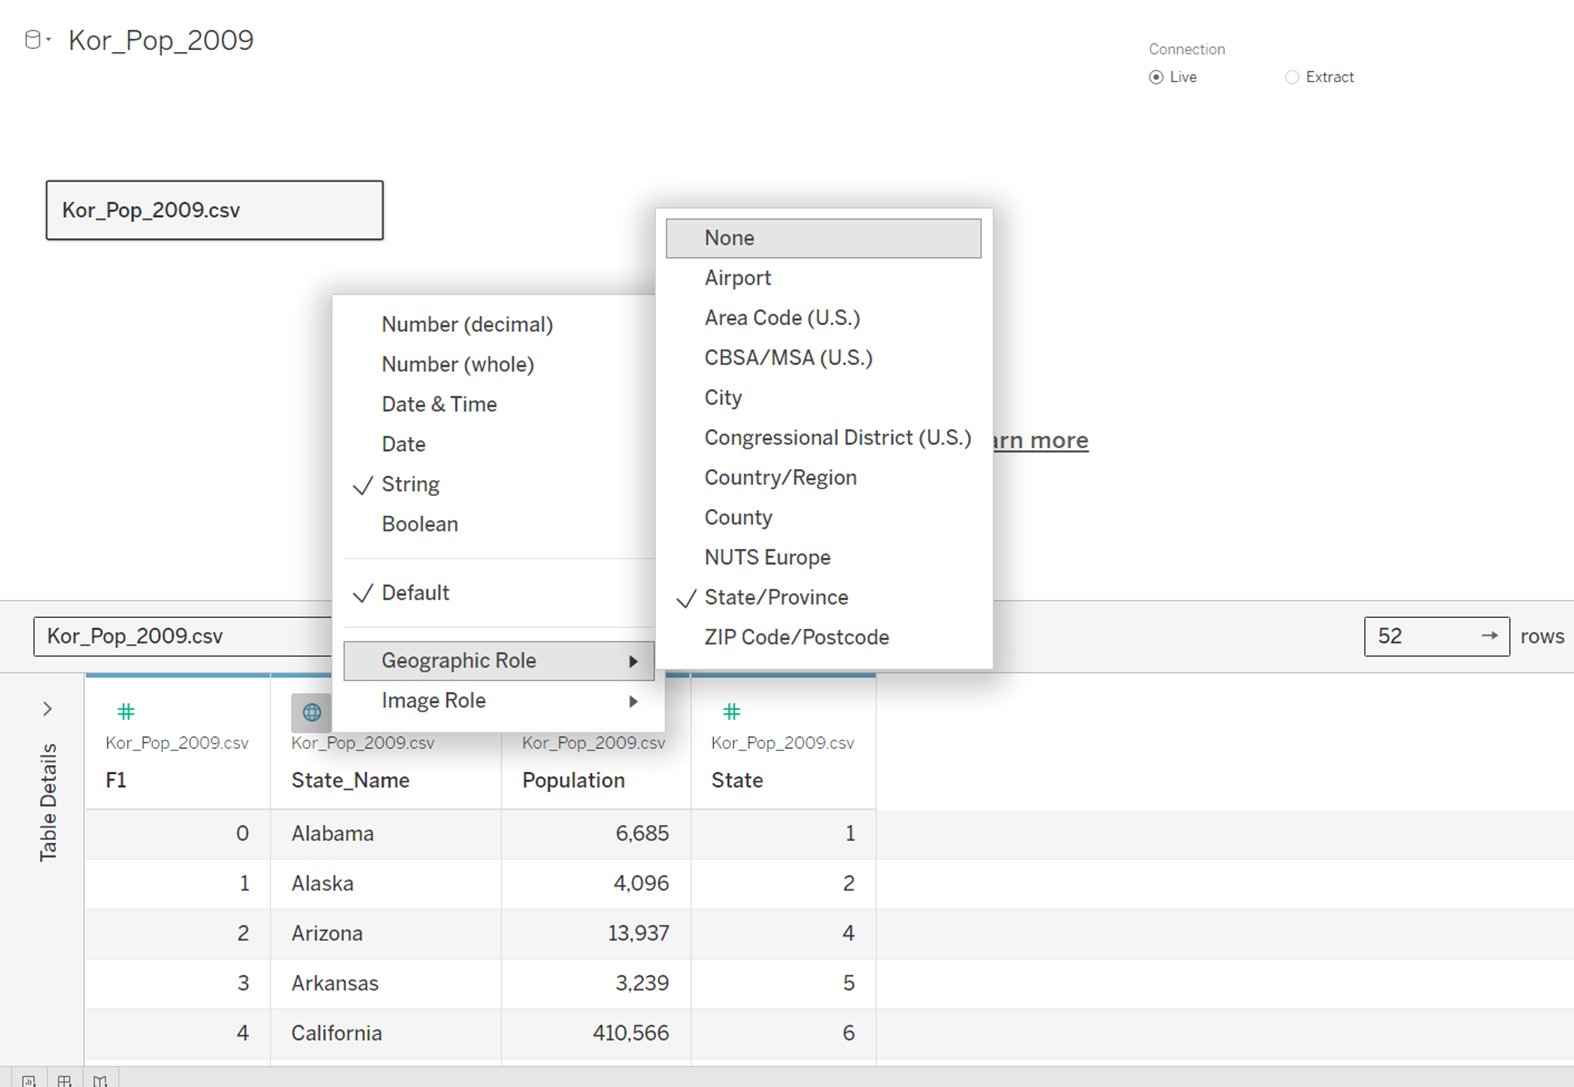
With help from our advisor Minsang Yoo, we scraped together CSV Census data to provide us with each and every state of the United States with the Korean population. With this simplified CSV data, we set each state to have its own geographic role for easy visualization through Tableau.
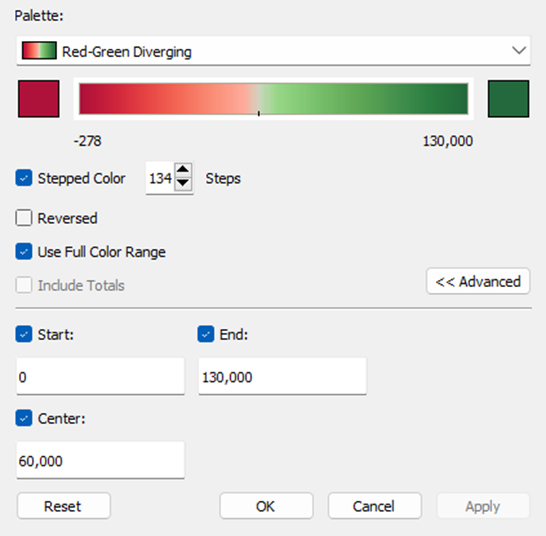
We created a map for each year from 2009 to 2021, containing the number of Korean Americans in each state as a number on the map and a color scale. However, California and New York included far too many Korean Americans compared to other states and were extreme outliers that stopped us from visualizing any significant changes from other states. To prevent this issue, we decided to exclude both states from the Tableau graphs, setting the scale from 0 to 130,000 people so we could see evident changes in color over the years in many different states other than California and New York.
▶Tableau Analysis
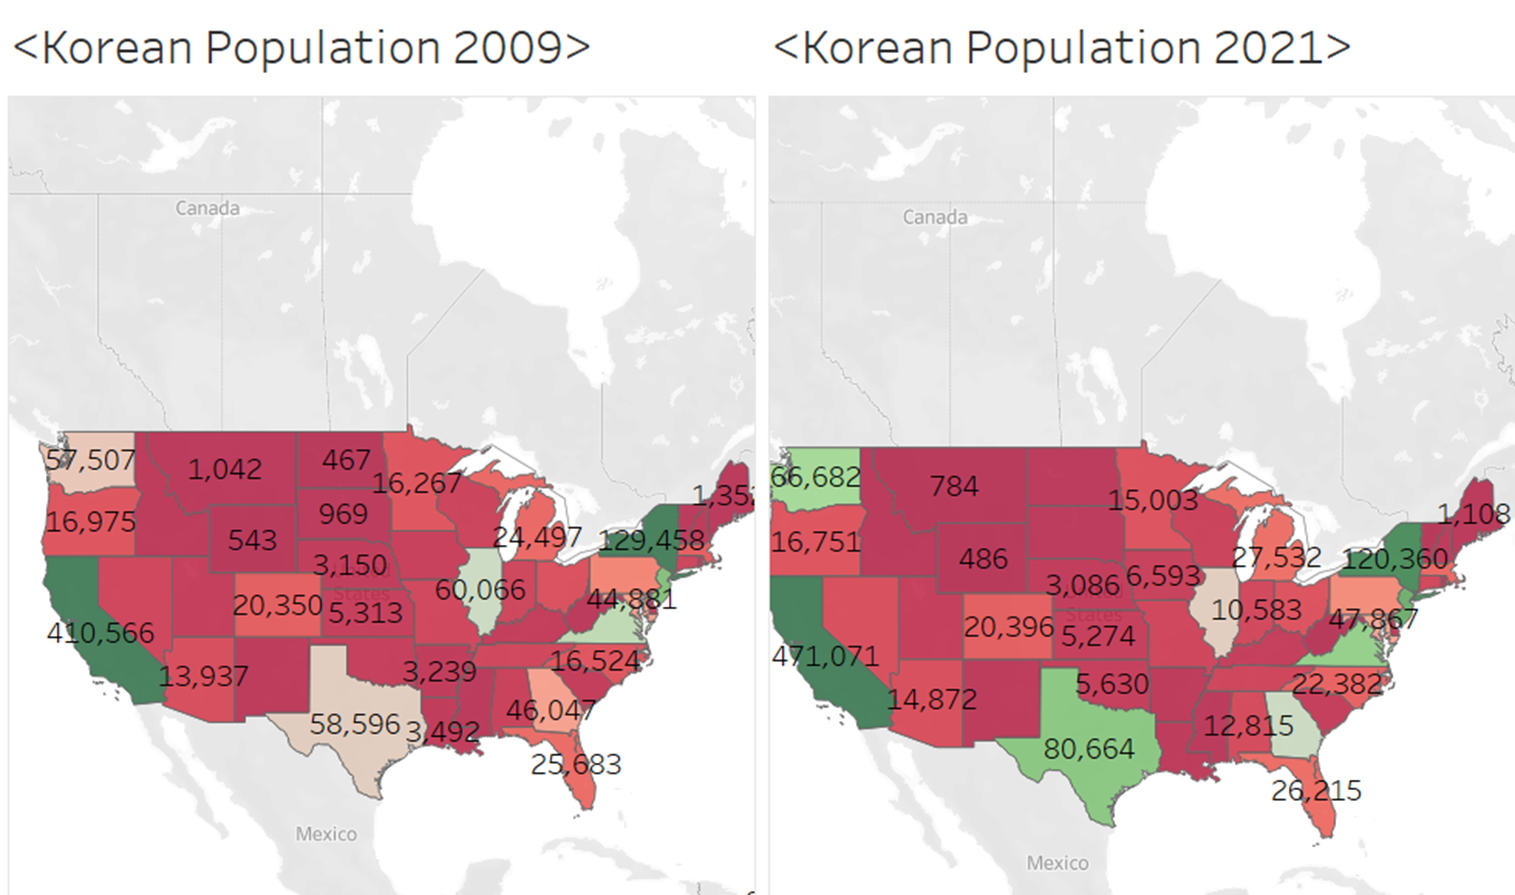
After putting the data of the 2009 and 2021 Tableau graphs side by side, we could visualize apparent shifts in the Korean population over time through color shifts from red to green. Excluding the large number of Korean Americans in California and New York, we saw a significant inflow of Korean Americans from 2009 to 2021. Between these years, Washington’s population grew by 9,175, Texas’s by 22,068, Georgia’s by 14,077, and Virginia’s by 12,180. We found that these states showed a huge population jump, as seen on the graphs through their color shifts.
We predicted that states with increasing technological job opportunities for Korean Americans were influencing these number shifts, especially in states like Texas and Georgia. One interesting state we found was Illinois. Although most states in America showed a general increase in the Korean American population, Illinois— which boasted a vast population of 60,066 Korean Americans in 2009— dropped to 58,909 over the years. One possible explanation is that the initial surge in population was driven by immigrants seeking refuge during the 1970s, particularly flocking to Illinois, especially Chicago; however, this trend did not remain consistent over the years.
Factors that Affect Population
With so many different variables that impact a person’s desire to live in a specific community, exactly pinpointing why a specific region has so many people can be difficult to track. Factors such as job opportunities, cost of living, or even climate can determine whether an area is suitable for a person. At one end of the spectrum, there are obvious factors like migration that determine population. However, other traits are much harder to determine without significant data and census analysis.
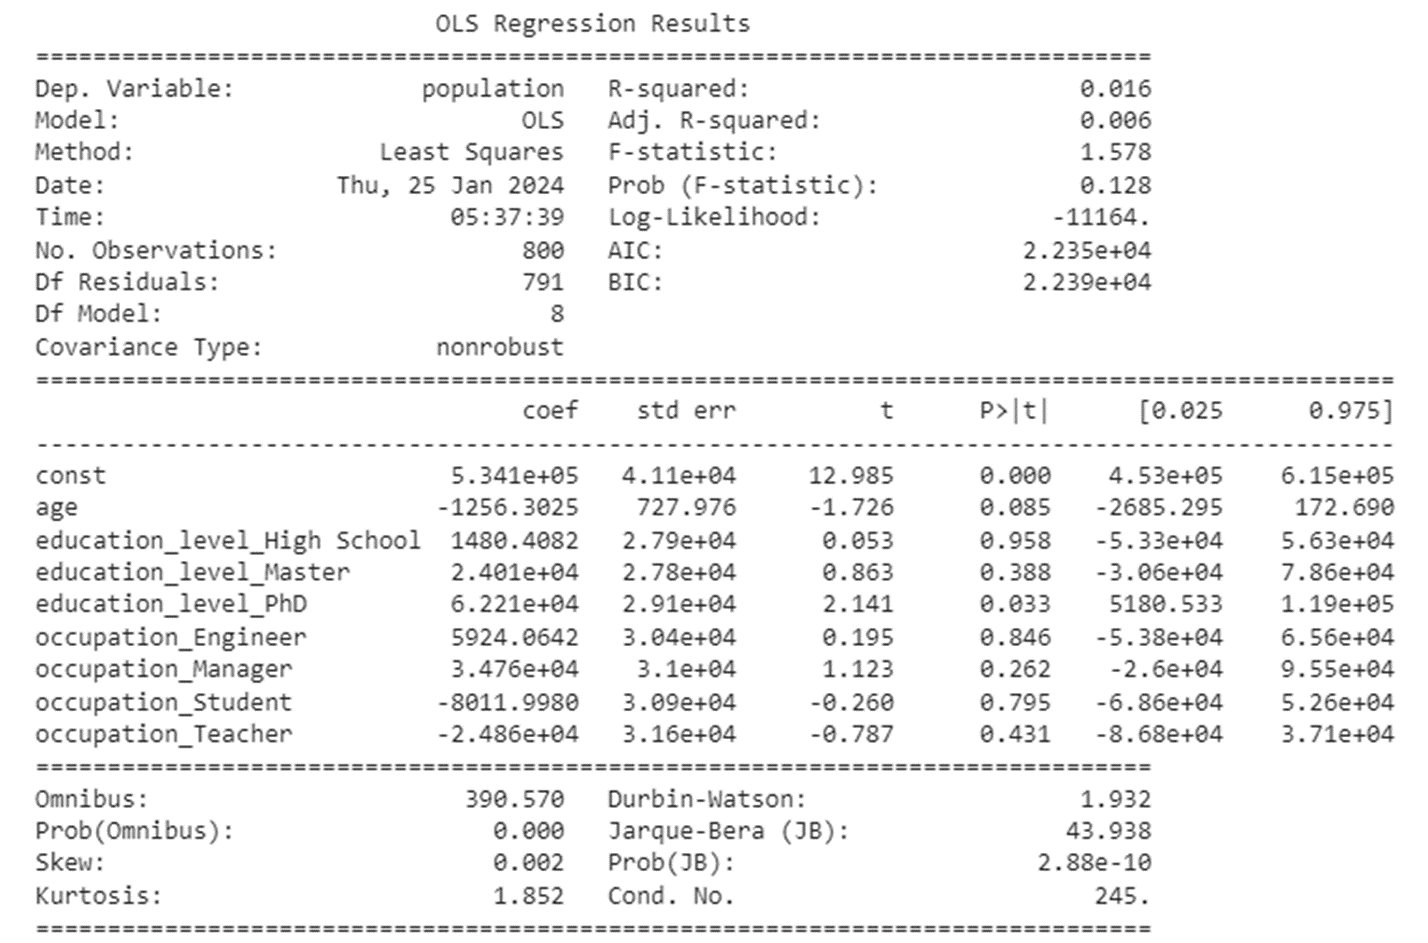
The regression table above shows examples of various education levels and occupations that a person might have within a Korean population, and the R^2 value in the top right demonstrates its ambiguity. Values close to 0 mean that the relationship between two variables has no correlation, and in this case, the relationships between age, education, or occupation do not correlate with the dependent variable of population. This regression table teaches us about how many different factors can cause population growth or decline, in turn weakening the relationship between population and its causes.
Demographics alone do not determine population growth, but rather the opportunity and benefit of living in such places. The most important factor in the population is migration. The ability to relocate to a city with vast opportunities where living situations are much better and have greater potential than native cities was significant, especially during the 1950s. As Koreans wanted to migrate especially because of financial debt and the Korean War, many relocated to the United States in areas like California, New York, or Texas to simply live more comfortable and affordable lives. Ever since, not much relocation has needed to occur since Koreans have already been successful in living in these areas with relative stability, with reproduction keeping populations stable. The most significant problem when it comes to Korean populations in recent years is the aging phenomenon discussed earlier in the article where people are aging faster than the rate of births. Despite this, it is up to life choices and advantages like metropolitan districts or culturally rich areas to stabilize and maintain Korea’s population in the States.
Final Reflection
In the culmination of our four-month journey under the guidance of USC Professor Seon Kim and his Korea Daily Data Science (KDDS) internship, we have gone deep into the demographic shifts within the Korean American population. Beginning with data sourced from the United States Census Bureau dataset, our exploration aimed to find trends and patterns within the growing Korean American communities in various states, with a particular focus on California, New York, New Jersey, Texas, and Virginia. What came from our analysis is a new understanding of a pressing issue: the aging trend within the Korean American populace.
As evidenced by our findings, the younger generation among Korean Americans is dwindling while the older generation is on the rise, signifying an overarching aging trend. While this phenomenon presents itself differently across states, with variations in population dynamics and contributing factors such as job markets, cost of living, and migration patterns, the aging trend remains consistent. From the heart of Korean Americans in California and New York to the growing cities of Texas and Virginia, the effects of aging are still felt, yet with different subtleties and consequences.
Our analysis has highlighted the complexity of changing demographics and the wide range of variables affecting population changes. Every factor, from cultural attractions to economic chances, is crucial in determining where people choose to live and prosper. Despite all of these complications, one thing is certain: the aging phenomenon is a serious issue that needs to be addressed to preserve all Korean American communities for years to come. Steps must be considered deeply and taken soon, or else Korean Americans will face a tragedy that cannot be undone. As we draw to a close our investigation, we are dedicated to finding new studies and developing strategies aimed at addressing the pressing issue of the aging trend within the Korean American population.


")
")