▶답= 학생들과 부모들은 재정보조를 신청하는데 많은 시간과 노력을 투자한다. 핵심은 연방정부 재정보조를 신청하기 위해 접수해야 하는 연방 무료 학비보조 신청서 (FAFSA)이다.
재정보조 신청 절차가 너무 복잡해 요즘 터보 택스 소프트웨어를 이용해 세금보고 서류를 접수하는 것이 더 쉽다는 우스갯소리가 나온다. 이런 이유로 대학에 진학하는 학생의 40%가 FAFSA를 접수하지 않는다고 한다.
FAFSA가 많은 비판을 받지만 투명성 하나는 인정받고 있다. FAFSA는 어떻게 재정보조 금액을 계산하는지에 대한 공식을 공개한다. SAI (Student Aid Index)가 바로 그 공식인데 2024~25학년도부터 SAI가 기존의 EFC(Expected Family Contribution)를 대체했다.
학생과 부모들은 FAFSA의 라이벌인 CSS 프로파일(이하 CSS)과도 씨름해야 한다. CSS는 400여 개 사립대와 극소수의 공립대 (미시간대 등)가 FAFSA와 함께 요구하는데 FAFSA보다 문항 수가 많아 작성하는데 더 많은 시간을 투자해야 한다.
CSS는 FAFSA와는 달리 투명하지 않다는 비판을 받는다. 어떤 방식으로 재정보조 금액을 계산하는지에 대한 정보를 일체 밝히지 않고 있다. 연방정부와 대학들이 주는 재정보조 외에도 각 주별로 자체 파이낸셜 에이드 프로그램을 운영한다. 이로 인해 재정보조 시스템이 더 혼란스럽게 보인다. 일부 대학은 재정보조 정책을 자주 바꾼다.
재정이 탄탄한 대학의 경우 저소득층/극빈층 학생을 대상으로 ‘론 없는’ 패키지를 제공하지만 어떤 대학은 그랜트와 융자, 워크 스터디를 혼합한 재정보조를 제공한다. 대체로 합격하기 어려운 명문대일수록 융자 없는 재정보조 패키지를 받을 가능성이 높다. 일부 대학은 연방정부 융자를 ‘재정 보조’로 포장해 마케팅에 활용, 비난을 사기도 한다.
현재 전국의 학생 및 부모들이 늦게 론칭한 2024-2025 FAFSA 때문에 골머리를 앓고 있다. 지난해 말 또는 1월 초 FAFSA를 접수했어도 빨라야 1월 말쯤 정보가 대학에 전달되며, 접수한 양식이 처리되기 전에는 수정이 불가능해 많은 학생들이 발을 동동 구르고 있다.
엎친 데 덮친 격으로 새 FAFSA를 만드는 과정에서 정부가 인플레이션 데이터를 업데이트하지 않은 것으로 드러나 FAFSA 정보가 대학에 전달되는데 더 많은 시간이 걸릴 수도 있다. FAFSA를 둘러싼 혼란이 하루라도 빨리 끝나기를 바란다.
태어나면서부터 부를 창출해 젊은이들에게 활력을 불어넣자는 목적으로 민주당 연방 상하원 의원 6명이 401어린이 저축법(401Kids Savings Act) 법안을 공동 발의했다고 CNBC가 지난달 31일 보도했다. 이 저축계좌는 주정부 재무부의 529 칼리지 세이빙 플랫폼에서 관리된다고 덧붙였다.
2019년 연방 정부 데이터에 따르면 18~24세 청년의 80% 이상이 자산 2만 달러 미만을 보유하고 있다. 이 법안의 목표는 자격을 갖춘 저소득층 한부모가 자녀가 18세가 될 때까지 5만3000달러 이상을 적립(contribution)해 줄 수 있도록 하는 것이다.
401어린이 저축법을 통해 자격이 되는 가정은 17세 이하 자녀 1명당 연간 최대 2500달러를 적립할 수 있다.
또 수정 조정총소득(MAGI)이 미혼 7만5000달러 미만, 기혼 15만 달러 미만인 가정은 자녀 1인당 연간 500달러의 정부 지원을 받게 된다.
근로소득세액공제(EITC) 수혜 자격 가정의 경우엔 EITC 청구 여부와 관계없이 자녀 1인당 연간 250달러를 추가로 더 받을 수 있다. 개인 적립에 대해서도 연간 최대 250달러까지 1대1 적립 매칭을 받을 수도 있다.
자녀는 18세가 돼야 기금을 사용할 수 있으며 교육, 훈련이나 주택 구매, 개업 등에 써야 한다. 또는 로스(Roth) 개인 퇴직 계좌나 장애아동을 위한 에이블(ABLE) 저축계좌로 이체할 수도 있다.
2024년 내 비즈니스의 전문적인 목표는 시스템 구축에 뛰어난 능력을 발휘하는 것이다. 현재 내가 제공하는 서비스는 단순하게 시간을 돈으로 바꾸는 것과 동일한 때가 많다. 이 접근 방식은 하루에 제한된 시간으로 인해 본질적으로 잠재 소득을 제한한다. 이 제한은 의사나 컴퓨터 과학자와 같이 고액 임금을 받는 전문가에게도 영향을 미치며 보편적으로 적용된다.
내실 있는 성장과 부의 창출의 핵심은 견고한 시스템을 만드는 데 있다. 거대 기업을 살펴보자: 맥도날드는 단순히 버거를 파는 곳이 아니라 식품 생산과 유통에 대한 전체적인 시스템을 갖추고 있다. 스타벅스는 그저 커피 전문점이 아니라 일관된 고객 경험을 제공하는 시스템으로 두각을 나타낸다. 아마존은 단순한 소매를 넘어 효과적인 상품 배송에 최적화된 시스템으로 진화했다. 이들의 기업 가치는 단순히 제품 뿐만 아니라 시스템의 일관성 및 지속 가능성에 있다.
이는 미국 교육 시스템의 중대한 결함을 강조한다. 숙련된 근로자를 배출하는 데에는 뛰어나지만 장기적인 비즈니스 성공에 필수적인 비전 있는 시스템 구축자를 양성하는 데에는 부족하다. 이러한 불일치로 인해 숙련된 근로자는 풍부하지만 수익성과 확장성을 가진 시스템을 개발할 능력이 있는 개인은 부족하다. 그 결과, 청년들이 기업의 전통적인 직원으로서 재정적 안정성을 확보하기가 점점 더 어려워지고 있다.
이것을 해결하기 위해서는 청년들이 관심을 주인 의식과 확장 가능한 시스템 구축으로 전환하도록 장려하는 것이 중요하다. 이를 시작하기 위한 몇 가지 단계는 다음과 같다:
기업가 교육을 추구하라: 기업가 정신과 경영학 과정을 추구해야 한다. 비즈니스의 기본뿐만 아니라 시스템을 만들고 관리하는 방법도 가르쳐야 한다. Coursera, LinkedIn Learning과 같은 온라인 플랫폼은 업계 전문가들의 귀중한 통찰력을 제공한다.
성공적인 비즈니스 시스템을 분석하라: 맥도날드, 스타벅스, 아마존과 같은 기업들의 운영을 연구해야 한다. 그들의 시스템화 접근 방식을 이해하는 것은 확장 가능하고 효율적인 시스템을 개발하기 위한 청사진을 제공한다. 시스템이 한 개인에게 크게 의존하면 효율성이 떨어지게 된다.
실제 경험을 찾아라: 효율적인 시스템을 가진 기업의 인턴십 또는 파트타임 근무를 통해 이론적인 연구가 제공할 수 없는 실질적인 통찰력을 얻을 수 있다. 이러한 시스템에 참여하는 것은 놀라운 경험이 될 수 있다.
멘토를 찾아 네트워크를 형성하라: 성공한 기업가와 네트워크를 형성하여 시스템 구축 및 관리에 대한 조언을 구하자. 비즈니스 행사에 참석하고 조직에 가입하며 시스템 개발과 관리에 대한 통찰력을 얻기 위해 적극적으로 멘토를 찾아 나서야 한다.
비판적 사고를 개발하라: 시스템 개선에 중요한 혁신적 사고와 문제 해결 기술을 길러야 한다. 상황을 비판적으로 분석할 수 있는 능력을 통해 비효율성을 발견하고 혁신적인 해결책을 제안하며 시스템을 지속적으로 개선할 수 있다.
작게 시작하여 배우고 적응하라: 소규모의 프로젝트로 시작하자. 작은 비즈니스를 처음부터 만들어 시작하면 다양한 비즈니스 요소를 응집력 있는 시스템으로 통합하는 데 중요한 통찰력을 얻을 수 있다. 진정한 배움은 실수하고, 적응하며 시스템 구축의 미묘한 차이를 이해하는 실제 경험으로부터 나온다.
이러한 측면에 초점을 맞춤으로써, 나는 학생들이 순전한 기술 중심의 교육 사고방식에서 시스템 사고의 복잡성과 이점을 인식하는 사고방식으로 전환할 수 있을 것이라고 믿는다. 기술 개발보다 시스템 구축을 강조하는 것이 재정 및 직업적 독립을 달성하기 위한 핵심 전략이다. 이 접근 방식은 개인이 경제 환경에 단순히 참여하는 것을 넘어 적극적으로 형성하고 방향을 정하는 힘을 주어 더 큰 자율성, 혁신 및 장기적인 성공으로의 문을 열어줄 것이다.
학생들의 새로운 ‘연방 무료학자금보조신청서(FAFSA)’ 관련 정보가 3월까지 전국 대학에 제공되지 않을 전망이다.
지난달 30일 교육부 발표에 따르면 FAFSA 데이터는 1월 말부터 각 대학에 전송될 예정이었으나 약 두 달 지연됐고, 이에 따라 학생들이 대학을 선택할 수 있는 기간이 촉박해졌다.
지연 원인에 대해 교육부는 “2024~2025학년도 신입생들의 지원 자격 계산 방법에 대한 오류를 수정하는 데 시간이 필요하기 때문”이라고 설명했다. 앞서 교육부는 수개월간의 지연 끝에 지난달 초 ‘Better FAFSA’라 불리는 새 FAFSA 양식을 공개했으나, 공개된 양식의 학생 및 가족 소득 계산 방법이 최근 인플레이션을 반영하지 않아 많은 학생들이 마땅히 받아야 할 지원금보다 적은 액수를 받을 가능성이 크다는 지적을 받았다.
교육부가 최근 인플레이션을 반영해 계산 방법을 수정하면서 학생 지원에 18억 달러가 추가로 투입될 것으로 예상되지만, 시기 지연으로 인해 학생들이 대학별 재정 지원 상황을 고려해 학교를 선택할 수 있는 시간이 줄어든다. 일반적으로 대학이 FAFSA 데이터를 처리하는 데 몇 주의 시간이 걸리기 때문에, 학생들은 4월까지 학교로부터 최종 재정 지원 제안을 받지 못할 확률이 높다. 신입생들은 대부분 늦어도 5월 1일까지 진학할 대학을 결정하기 때문에, 대학별 재정 지원 제안을 비교할 시간이 부족할 수 있다.
전문가들은 이로 인해 대학 진학 시 재정 지원 상황을 최우선으로 고려하는 저소득층 학생들이 가장 큰 영향을 받을 것을 우려하고 있다.
전국 학교에 홍역(measles) 비상이 걸렸다. 남가주 지역 350개 학교도 학생 홍역 백신 접종률이 낮아 신경을 곤두세우고 있다.
31일 연방질병통제예방센터(CDC)에 따르면 미전역에서 홍역 바이러스에 의한 감염자가 발생하고 있다. CDC는 최근 홍역 바이러스는 예상 밖으로 빠르게 퍼지고 있다고 우려했다.
홍역은 1~6세 어린이 등 청소년이 주로 봄철에 감염된다. 감염자 기침 또는 접촉 시 주변으로 바이러스가 퍼진다. 킨더가든 등 학교에서 전염병 확산 방지를 위한 각별한 주의가 필요하다.
홍역 바이러스에 감염되면 10~12일 뒤 ‘화씨 105도까지 발열, 콧물, 결막염, 홍반성 반점, 구진’ 등이 동반된다. 감염자는 입안 점막에 작은 흰 반점, 온몸에 붉은 발진이 돋는다.
보건당국은 홍역은 한 번 백신을 접종하거나 감염되면 재발률이 희박하다고 전했다. 또한 보건당국은 홍역 증상이 나타날 때는 주변인과 접촉을 차단하고 학교 등에 알려 추가 감염을 막아야 한다고 강조했다.
한편 CBS뉴스는 전국 8500개 학교 재학생의 홍역 백신 접종률이 93% 이하라며 전염병 확산 가능성이 높다고 31일 보도했다. CBS뉴스는 CDC를 인용해 2021~2022학년도 미국 내 킨더가든 학생의 홍역 백신 접종률이 93%로 몇 년 전 접종률 95%에도 못 미친다고 전했다.
캘리포니아주의 경우 2021~2022학년도 취학아동 대상 홍역 백신 접종률은 96.6%로 나타났다.
학생 과밀로 7·8학년 타교 전출 학부모 수업 거부 시위 등 반발 한인학생 100명, 이중언어 제공
캠퍼스에 정해진 숫자보다 더 많은 학생들이 등록하고 있다면 학교는 어떤 조치를 취해야 할까. 한인 학생도 100여명 재학 중인 포터랜치스쿨(Porter Ranch Community School)이 늘어나는 학생 숫자를 감당할 수 없어 7~8학년 중학생들을 다른 학교로 보내는 방안을 밝히자 학부모들이 대거 반발하고 있다.
일부 학부모와 학생들은 29일 등교 시간에 맞춰 수업을 거부하고 반대 시위를 진행하기도 했다.
해당 학교에는 현재 1400여 명이 재학 중인데 관내 학생들의 등록을 더이상 받지 않고 있다. 갈수록 숫자가 줄어 폐교하는 LA통합교육구 일부 학교의 현실과는 180도 다른 모습이다.
재학생 중 아시안은 31%, 백인이 26%, 라틴계가 17%다. 학교는 한국어 이중언어 프로그램(KDLP)이 10년 넘게 운영한 곳으로도 잘 알려져 있다.
시위 학부모들은 여러 자녀를 한 학교에 보내고 있어 중학생들을 채츠워스고교(4.5마일 거리)로 옮기면 불편이 가중되며, 성적이 우수한 학생들을 다른 캠퍼스에 보내는 것은 학부모 입장에서 찬성할 수 없다는 것이다.
의견 차이가 좁혀지지 않자 학교 측은 29일 저녁 600여 명이 참가한 가운데 토론회를 열었지만 해결책이 제시되거나 의견 조율이 되지 않았다.
LA통합교육구 북부지역을 담당하는 데이비드 바카 교육감은 “내년까지는 전학이 없다”고 못박고 “다만 학생들의 안전한 교육현장 마련이라는 대원칙을 위해 다양한 선택안을 준비할 것”이라고 29일 전했다.
학교 주변에서는 인근에 학교 건물을 짓자거나 가건물이라도 동원하자는 의견도 나오고 있지만 현실적으로 어려운 상태다.
한편 캠퍼스 인근 신규 주택 공사가 마무리 되고 있어 내년에도 적지않은 학생들이 입학을 희망할 것으로 알려지면서 교육구와 학교측의 고민은 더욱 깊어질 전망이다.
아이를 잘 키우고 싶은 건 모든 양육자의 바람이다. 아이에게 뭘 어떻게 해주면 될까? 이남옥 한국상담대학원대학교 교수는 “아이가 아니라 부부에서 답을 찾아야 한다”고 말했다. 부부가 편안하고 행복해야 아이도 잘 자랄 수 있다는 것이다.
부부·가족 상담 전문가인 이남옥 교수는 “아이를 잘 키우려면 아이와의 관계보다 배우자와의 관계부터 점검하라”고 조언했다. 부부가 갈등하는 가정에선 아이들이 건강하게 자랄 수 없기 때문이다. 장진영 기자이 교수는 부부·가족 상담 분야에서 손꼽히는 권위자 중 한 명이다. 독일에서 가족 갈등 관리 조정 전문가로 활동하다 2003년부터 한국에서 가족 상담 전문가로 활약해왔다. 중앙일보 프리미엄 구독서비스 The JoongAng Plus 안에서 밀레니얼 양육자를 위한 콘텐트를 만들고 있는 헬로페어런츠(hello! Parents)는 지난 24일 그를 인스타그램 라이브 방송에 초대했다. 1시간여 동안 오간 독자와의 질의응답을 정리했다.
Q : 아이를 키우는 데 있어, 부모와 아이의 관계가 아니라 부부 관계가 더 중요하다고요?
A : 부부 사이가 나쁘면, 아이는 부모와 건강한 관계를 맺을 수 없어요. 엄마가 아이에게 아빠 흉을 보거나 “너 때문에 산다”는 식으로 신세 한탄을 하면 아이는 어떻겠어요? 아빠와 좋은 관계를 맺을 수도 없고, 엄마의 불행이 나로 인한 것이라는 자책을 할 수도 있죠. 아이가 정서적으로 건강하길 바란다면, 무엇보다 부부가 행복해야 합니다.
Q : 아이가 어떤 상태인지 잘 알아야 도움도 줄 수 있을 텐데요. 속마음을 잘 이야기하지 않는 아이라면, 어떻게 도와줘야 할까요?
A : 감정을 알아채고, 표현하는 건 쉬운 일이 아닙니다. 양육자가 아이의 감정을 세심하게 알아차려 주는 게 중요하죠. 아이가 말을 해야만 알아챌 수 있는 건 아니에요. 말투, 표정, 행동도 다 신호거든요. 아이의 감정을 파악한 뒤에 어떻게 행동하느냐도 중요합니다. “화내지 마”, “울지 마”라고 말하는 건 정서적인 폭력이에요. 아이가 느끼는 감정을 무시하라고 강요하는 거니까요. “화가 났구나. 화가 나는 이유가 있을 거야. 왜 화가 났는지 한 번 생각해볼까?”라고 말해주세요. 감정을 긍정하고, 원인을 파악해서 대처할 수 있도록요.
Q : 양육자가 먼저 감정이나 속마음을 이야기하는 게 도움이 될까요?
A : 물론이죠. 평소 감정에 관해 이야기를 나누면 좋아요. “행복해”, “신나” 같은 긍정적인 감정뿐 아니라 “화가 나”, “속상해” 같은 부정적인 감정도 말하세요. 소리 지르면서 화를 내는 것과 화나는 감정을 이야기하는 것은 다른 거예요. 잘 표현하면 상대도 그 감정을 존중할 수 있죠. 부부끼리 부정적인 감정을 서로 이야기하면서 푸는 모습을 보여주면, 아이도 배울 수 있어요.
Q : 아이가 “난 잘 못해”, “내가 싫어” 같은 말을 한다면, 어떻게 해야 할까요?
A : 아이가 그런 말을 한다면, 우선 양육자가 스스로를 돌아봐야 해요. 아이가 혼자 부정적인 자아상을 세우는 경우는 없어요. 아이가 가장 많이 상호작용하는 사람이 부모잖아요. 아마도 부모에게서 부정적인 얘길 많이 들었을 가능성이 큽니다. “더 잘해야 돼”, “이런 점이 부족했어” 같은 얘기를 많이 하지 않았는지 자문해 보세요. 아이의 생각을 바꾸려면 긍정적인 얘길 많이 해야 해요. 지금의 2~3배는 더 해야 하죠. 한두 번의 노력으로 아이가 바로 변하진 않을 거예요. 길게 보고 계속하셔야 합니다. 인생에 늦은 때란 없으니, 포기하지 마시고요.
Q : 새로운 것에 도전하는 걸 주저하는 아이는 어떻게 도와줄 수 있을까요? 이 질문을 하신 분은 아이가 완벽주의 성향이 있고, 불안도가 높은 것 같다고 하셨어요.
A : 아이의 기질은 저마다 다릅니다. 좋은 것도, 나쁜 것도 아니고요. 양육자가 아이의 특성을 부정적으로 봐선 안 됩니다. 조심스러운 성향이라면, 새로운 환경에 도전하는 데 주저하는 게 당연해요. 이때 엄마가 부정적으로 묘사하거나 염려하면, 아이는 자신에 대해 부정적인 인식을 가집니다. 염려하기보다 아이가 불안을 느낄 요소를 찾아서 함께 제거한다면, 아이는 더 잘 적응할 수 있을 겁니다.
Q : 곧 신학기가 시작되는데요. 친구와 잘 어울리지 못하는 아이에겐 어떻게 말해주면 좋을까요?
A : 모든 인간관계의 뿌리는 양육자와의 관계입니다. 부모에게 인정받고, 사랑받으며 자란 아이는, 자신감을 갖고 타인과 관계를 맺습니다. 그래서 아이의 친구 관계가 고민이라면, 양육자와의 관계부터 점검하는 게 필요하죠. 양육자와의 애착은 오랜 시간에 걸쳐 형성되는 겁니다. 당장 친구 관계로 어려움을 겪는 아이에게 도움을 주고 싶다면, 우선 아이의 마음을 알아주세요. 아이의 상황을 평가하려고 하지도 말고, 성급하게 해결책을 주려고 하지도 마시고요. 그냥 매일 매일 아이의 이야기를 듣기만 하세요. 그리고 이렇게 말해주세요. 너는 충분히 좋은 아이고, 친구 관계는 반드시 좋아질 거라고요. 낙관을 심어주는 것이야 말로 양육자가 해야 할 일이죠.
Q : 아이가 친구로부터 괴롭힘을 당하고 있다면, 어떻게 대응해야 할까요?
A : 아이가 스스로 지키는 힘을 갖도록 하는 것도 양육자의 역할이에요. “무시하라”거나 “너도 똑같이 해”라고 하는 건 결코 좋은 대처가 아닙니다. 괴롭히는 행동은 옳지 않다고, 그 행동 때문에 기분이 나쁘다고 말할 수 있어야 해요. 그래도 해결되지 않으면, 선생님이나 주변 어른들에게 도움을 청해야죠. 이런 상황에서 양육자는 “네 옆에 항상 내가 있다”는 걸 알려줘야 합니다. 자기를 무조건 지지하는 사람이 있다는 사실 자체가 아이에게 큰 힘이 되거든요.
Q : 형제·자매·남매 사이 갈등에 관한 질문이 유독 많은데요. 첫째가 둘째를 싫어하고 괴롭힌다는 고민이 주를 이룹니다.
A : 아이들은 누구나 부모의 사랑을 갈구해요. 형이나 언니 혹은 동생과 부모의 사랑을 나눈다는 느낌이 썩 반갑진 않을 거예요. 그런데 심지어 덜 받는다고 느끼면 어떨까요? 만약 첫째가 동생을 괴롭힌다면, 행동을 바로 잡기에 앞서 아이가 왜 그런 행동을 하는지부터 살펴봐야 해요. 엄마·아빠의 사랑이 동생에게 더 많이 간다고 느낄 가능성이 높거든요. 부모들도 형제 관계를 훈육에 이용하기도 해요. “형 좀 보고 배워라”, “동생만도 못하네” 이런 식으로요. 이렇게 비교하면, 아이들의 싸움은 더 치열해집니다. 만약 아이들이 싸운다면, 두 아이의 이야기를 모두 들어주는 것부터 시작하세요. 그리고 양쪽 모두 수긍해주세요. “얘기를 들어보니 왜 싸웠는지 알겠다” 하면서요. 섣불리 누구 편을 들거나, 다 듣지도 않고 잘잘못을 가려주려 들면 안 됩니다.
Q : 아이들이 이런 질문 자주 해요. “누구를 더 사랑해?” 하는요. 이럴 땐 뭐라고 답해야 하나요?
A : 논리적으로 답하려 해선 안 됩니다. 아이가 “내 눈이 커, 작아?”라고 물어본 게 아니잖아요. 질문한 아이의 마음을 들여다보세요. 어떤 답이 듣고 싶을까요? “네가 최고지”라는 말 아니겠어요? 그 마음을 알아주세요. 그렇게 답하면, 옆에서 듣던 다른 아이가 “그럼 나는?” 하겠죠? 그럼 또 “너도 최고지!”하고 답해주면 됩니다. 아이의 마음을 들여다보면 답이 나와요.
지난 24일 진행된 hello! Parents 인스타그램 라이브 방송의 모습. 화면 위는 진행을 맡은 이송원 기자, 화면 아래는 이남옥 교수다.이남옥 교수는 방송을 마무리하면서 “좋은 양육자, 좋은 부모가 되기 위해 노력하는 모습 자체가 아름답다”고 말했다. 그러면서 그는 “완벽한 부모, 좋은 부모가 되려고 애쓰는 것보다 스스로 편안하고 행복한 게 우선”이라고 강조했다.
전하나 객원기자 telmen@kakao.com, 정선언 기자 jung.sunean@joongang.co.kr
By: James Kim, Howard Jung, Jaemin Kwak, and Jeremiah Chun (Under supervision of Minsang Yoo)
Introduction
For the past four months, our group has been working under USC Professor Seon Kim and his Korea Daily Data Science (KDDS) internship to uncover trends within the Korean American population. It is imperative that we recognize the data used in this project came from the United States Census Bureau dataset (https://data.census.gov/), and our conclusions are rooted in the trends provided by this dataset. What we hope readers take away from this article is a deeper understanding— one based in fact— of the Korean American population crisis, and what is to come of it in the following years.
General Overview
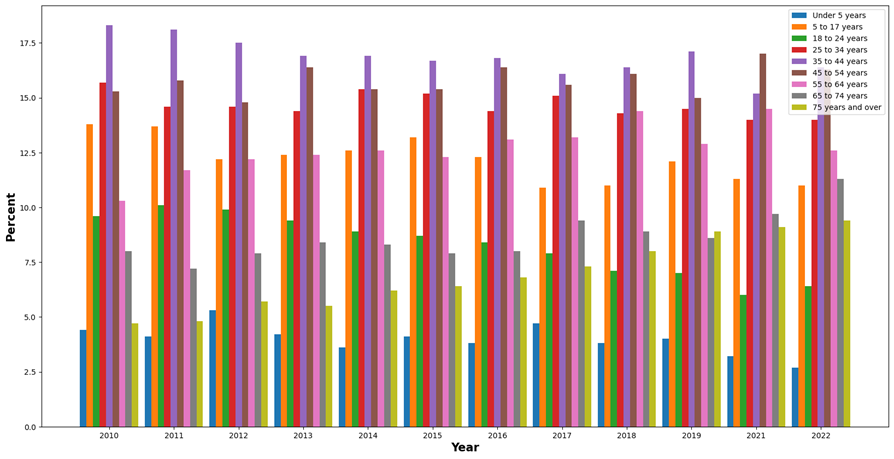
Simply put, within the Korean-American population, the younger generation is dwindling while the older generation is on the rise— meaning that as a whole, Korean Americans are aging. To figure out why that was happening, we decided to compile data from many different states but specifically focused on these five: California, New York, Texas, Virginia, and New Jersey. These five states contained the most amount of data in the dataset, allowing for much deeper findings.
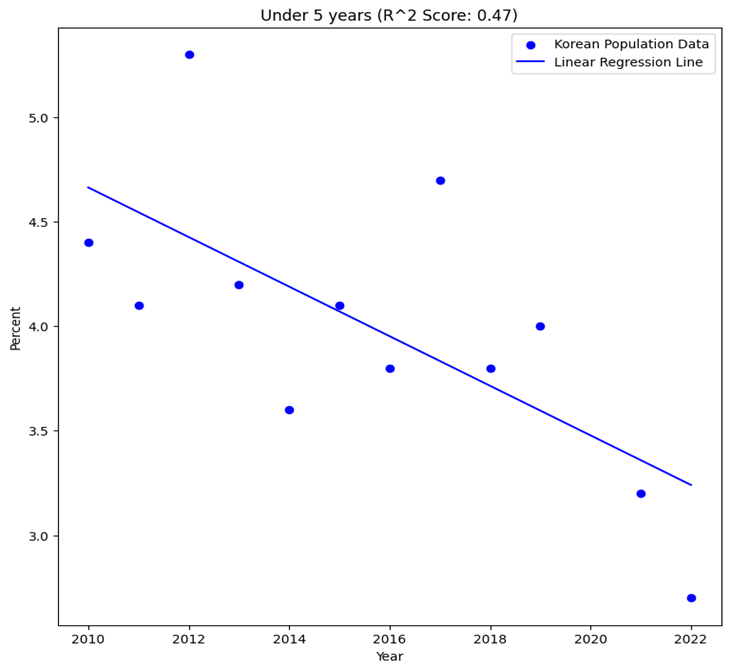
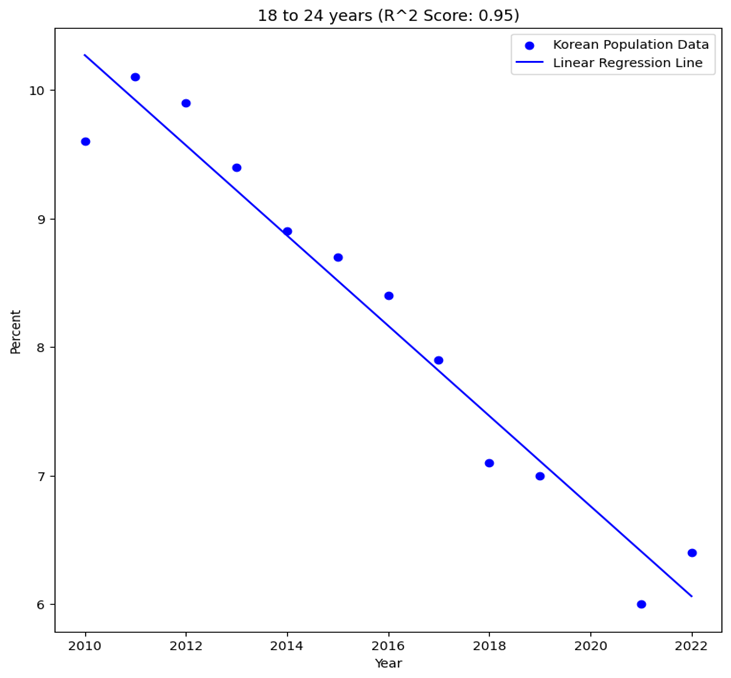
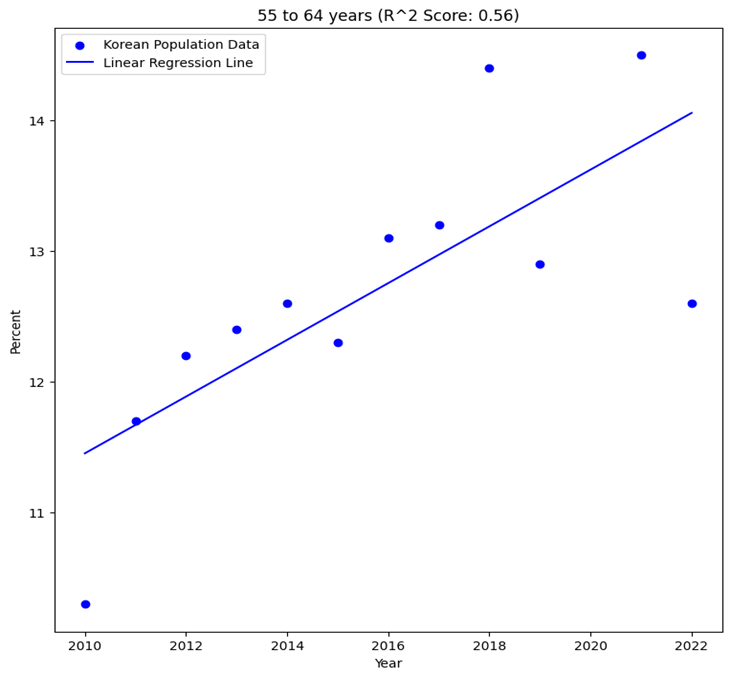
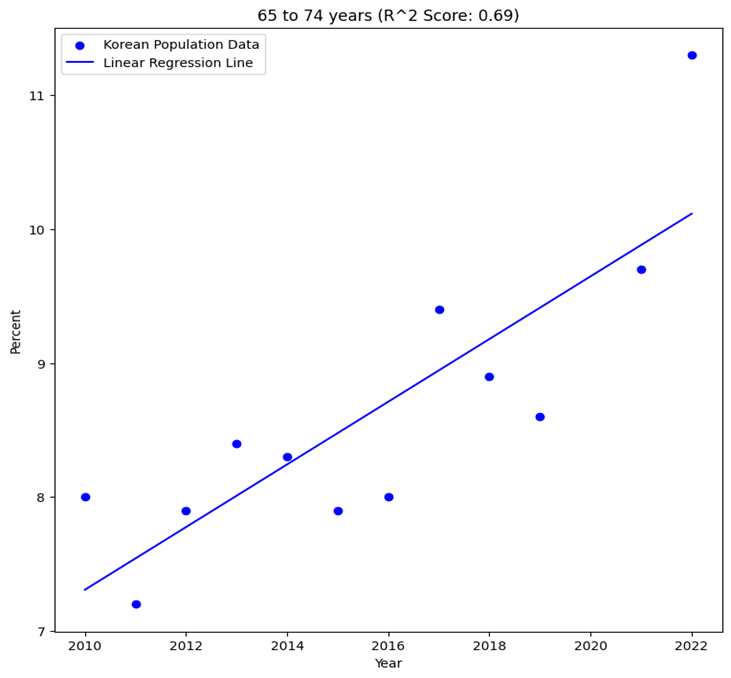
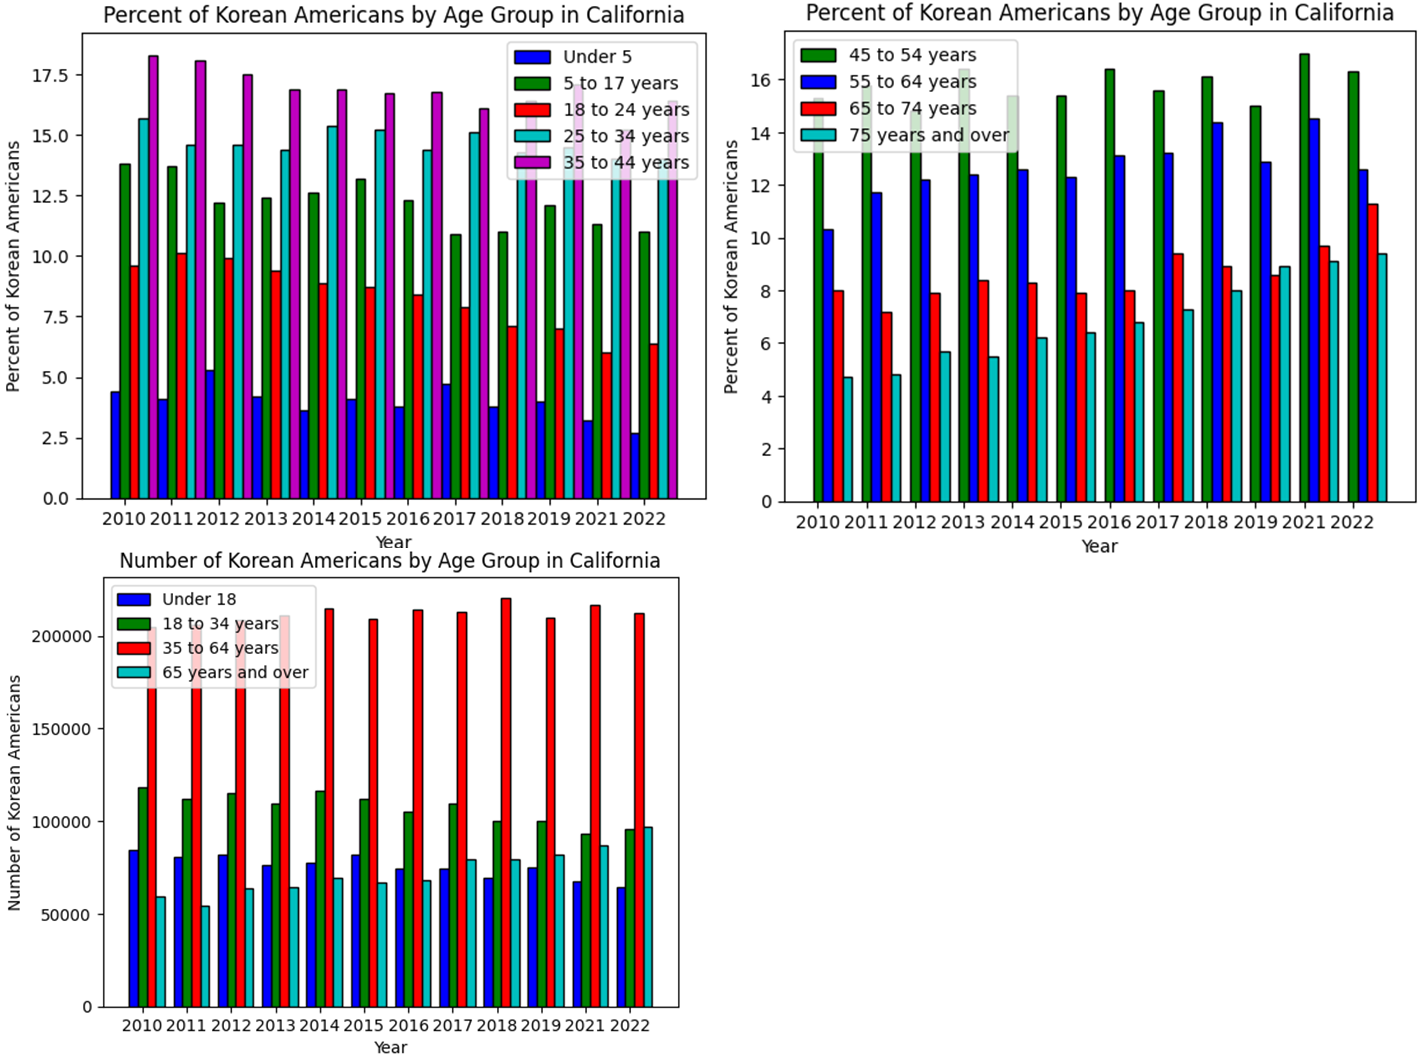
This bar plot represents data from California; however, is also representative of the other four states as they all showed a similar pattern. When analyzing the barplot, there is a clear trend that is shown: the amount of Korean Americans under the age of 45 years is on a steady decline, while there is a growing number of ages above it. In order to investigate this phenomenon further, we decided to look into the specific age ranges. This was done by utilizing linear regression to identify trends and also predict what will happen to the population as time goes on.
We found that these graphs supported the claim that Korean Americans are aging. This means that over the years, there have been fewer births annually in parallel with a consistent growth of the older populations. One conclusion to take away is that if these trends continue, at some point soon, the Korean American population will die out. One important discovery we found could be attributed to great bounds in fields such as technology and medicine, as thanks to these advances, older people, more specifically older Korean Americans have been able to survive longer. This explains why there has been such an increase in the older generations of Korean Americans; however, did not explain the shrinking younger population. While we could assume that Korean Americans were choosing to not have children, this assumption was not supported by any evidence. To find what may have led to these diminishing numbers in younger generations, a more in-depth analysis was needed.
In-Depth Reflection
Korean Americans are aging. Older Korean Americans are not being superseded by younger generations, whether it be the descendants of Korean migrants or those who directly immigrated at a young age. We found that states traditionally considered Korean American hotspots (California, New York, New Jersey) suffered the most from this aging compared to most states. Although other states (such as Texas, Virginia, etc.) have an aging Korean American population, these states notably have a growing population of working-age Korean Americans that is not as present in traditional Korean American states.
Known for hosting the Mecca of Korean American society, Korea Town, California’s Korean American population has undoubtedly been hit hard by population aging. In the oldest year that the Census dataset provides, the number of Korean Americans under 35 years old totaled 202,836, nearly 40% of the Korean Americans in California. Come 2022, that number has significantly fallen. Korean Americans under 35 years old only numbered 159,725, dropping to 34% of all Korean Americans in California. On the surface, these numbers may seem insignificant, but they confirm that the amount of young Korean Americans within California has been dropping, which is a strong indicator of population aging.
What’s left is to look at the older generations, or what we consider to be the elderly. In 2010, Korean Americans above 65 years old numbered 59,206, nearly 13% of the Korean Americans in California. In 2022 this number shot up to 96,854, an increase of 20.7%. This stark rise in comparison to the decrease in the younger generations demonstrates that elderly Korean Americans aren’t just aging, they are immigrating. The data shows that California has become a major hotspot for the immigration of elderly Korean Americans from other states and even Korea itself.
One question arises: “Why don’t young Korean Americans want to at least stay in the Golden State? Why do they want to leave the Bay?” To that, we say it could be due to rising job markets in other states. With Silicon Valley’s market declining, many big tech companies have looked elsewhere to set up shop. Simultaneously, California is no longer America’s startup workshop. That honor has shifted to Manhattan’s glowing Financial District and Chicago’s skyscrapers. This fleeting job market combined with the declining living standards in California may encourage Korean Americans to leave, as this demographic is typically known to be ambitious, hardworking, and pioneering.
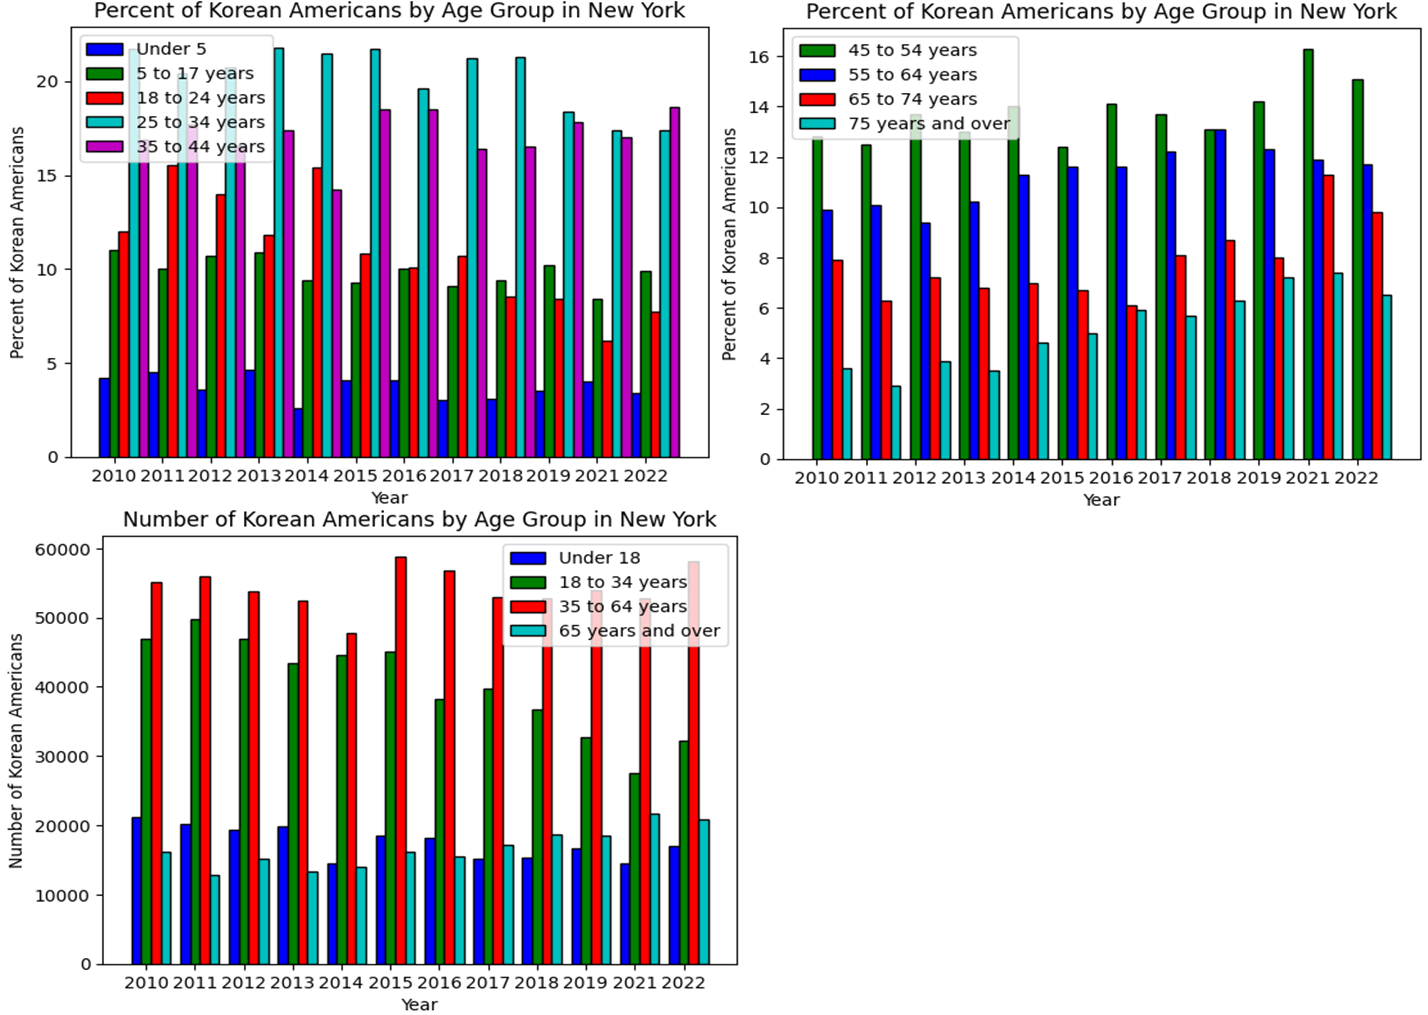
New York City, a city built on hopes and dreams of the Industrial Revolution and one that spearheaded America for centuries with its massive shipping and industrial base backed by the largest financial firms in the world. Combined with its cultural production of fashion, music, and sports, how could America’s diamond lose its luster? As it turns out, we can see clearly through a reflection of its Korean American population. In 2010, the count of Korean Americans under 35 stood at 68,132, making up 49% of the demographic in New York. By 2022, this figure had declined to 49,154, representing 38.4% of the community in the state. Conversely, Korean Americans above 65 years old witnessed an increase. Initially, there were 16,136 elderly Korean Americans in 2010, accounting for 11.5% of the population in New York. By 2022, this group had expanded to 20,865, now comprising 16.3% of the Korean American populace in New York. This demographic shift reveals that there is a trend of younger individuals decreasing while the elderly population increases, we found that this was an indicator of potential changes in the dynamics and needs of New York’s Korean American community.
Something worth noting, however, is that the trend has been reversing in recent years. Between 2021 and 2022, the age groups under 65 years old saw increases in population while the elderly population unexpectedly decreased. One possible explanation for this phenomenon could be due to the re-emergence of New York’s Financial District with rising companies such as Jane Street making their breakthroughs on the job market that year. These breakthroughs have attracted many working-class Korean Americans to relocate to New York. While this does explain what happened to the growth in the younger population, it doesn’t quite describe why the elderly population, which had been consistently on the rise in New York, had suddenly dipped that year.
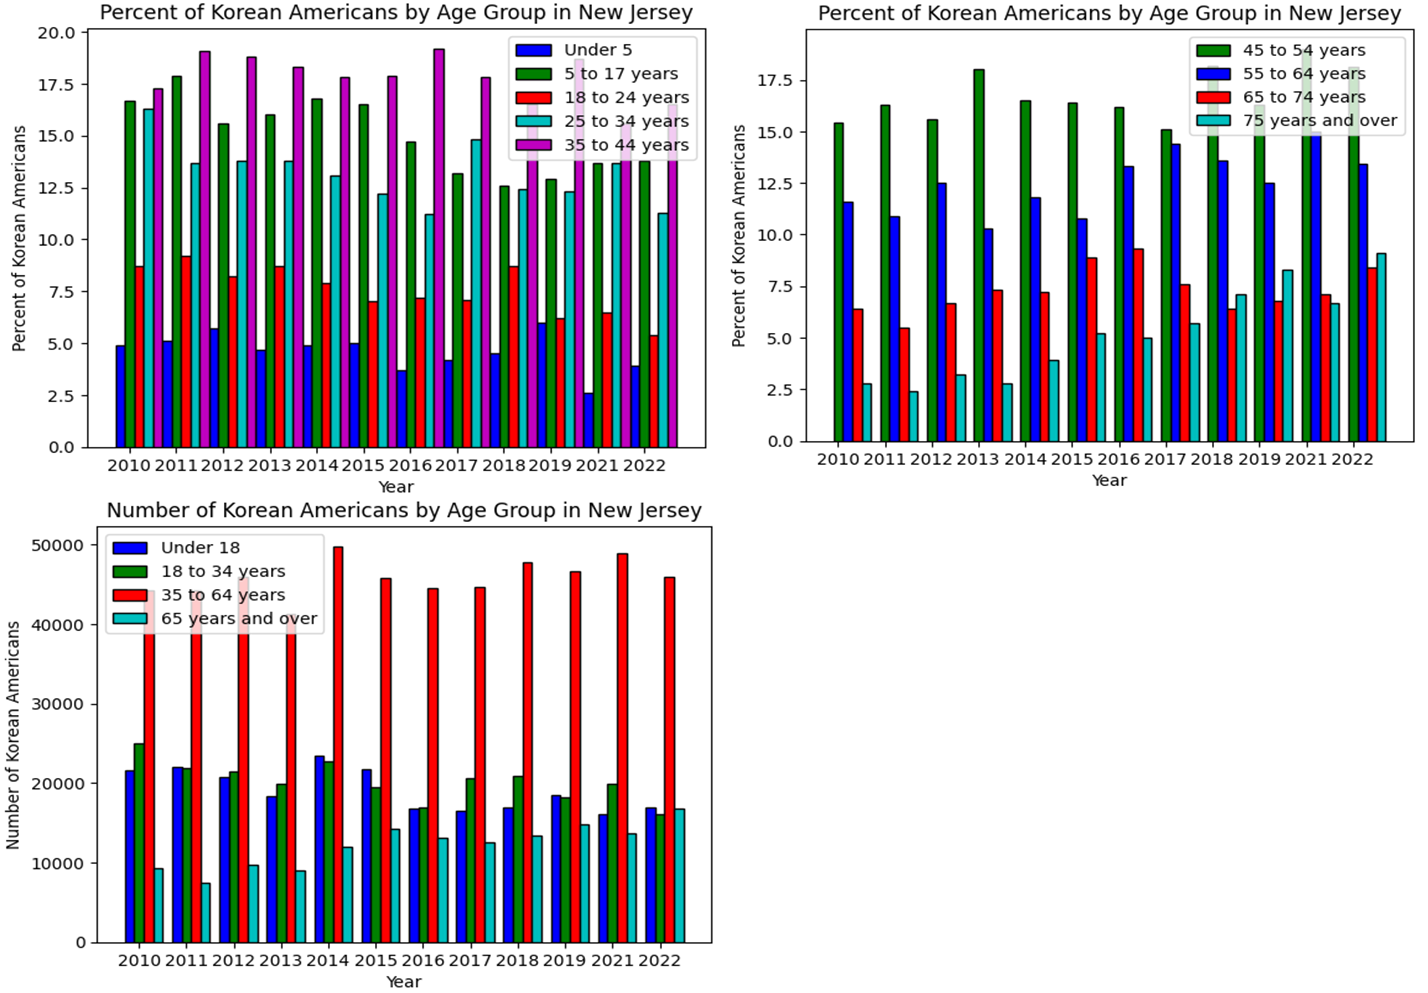
Similarly to California and New York, New Jersey holds similar trends. In 2010, the count of Korean Americans under 35 years old in New Jersey stood at 46,595, making up 46.6% of the demographic in the state. By 2022, this figure had decreased to 33,012, representing 34.4% of the community in New Jersey. Interestingly enough, the population of middle-class Korean Americans—aged 35 to 64 years old, encompassing those around the working age and approaching retirement—would rise between 2019 and 2022, only to drop. What this could imply is that New Jersey’s job market provided what could be considered more stable jobs for higher-level employees rather than entry-level, internships, or startup positions.
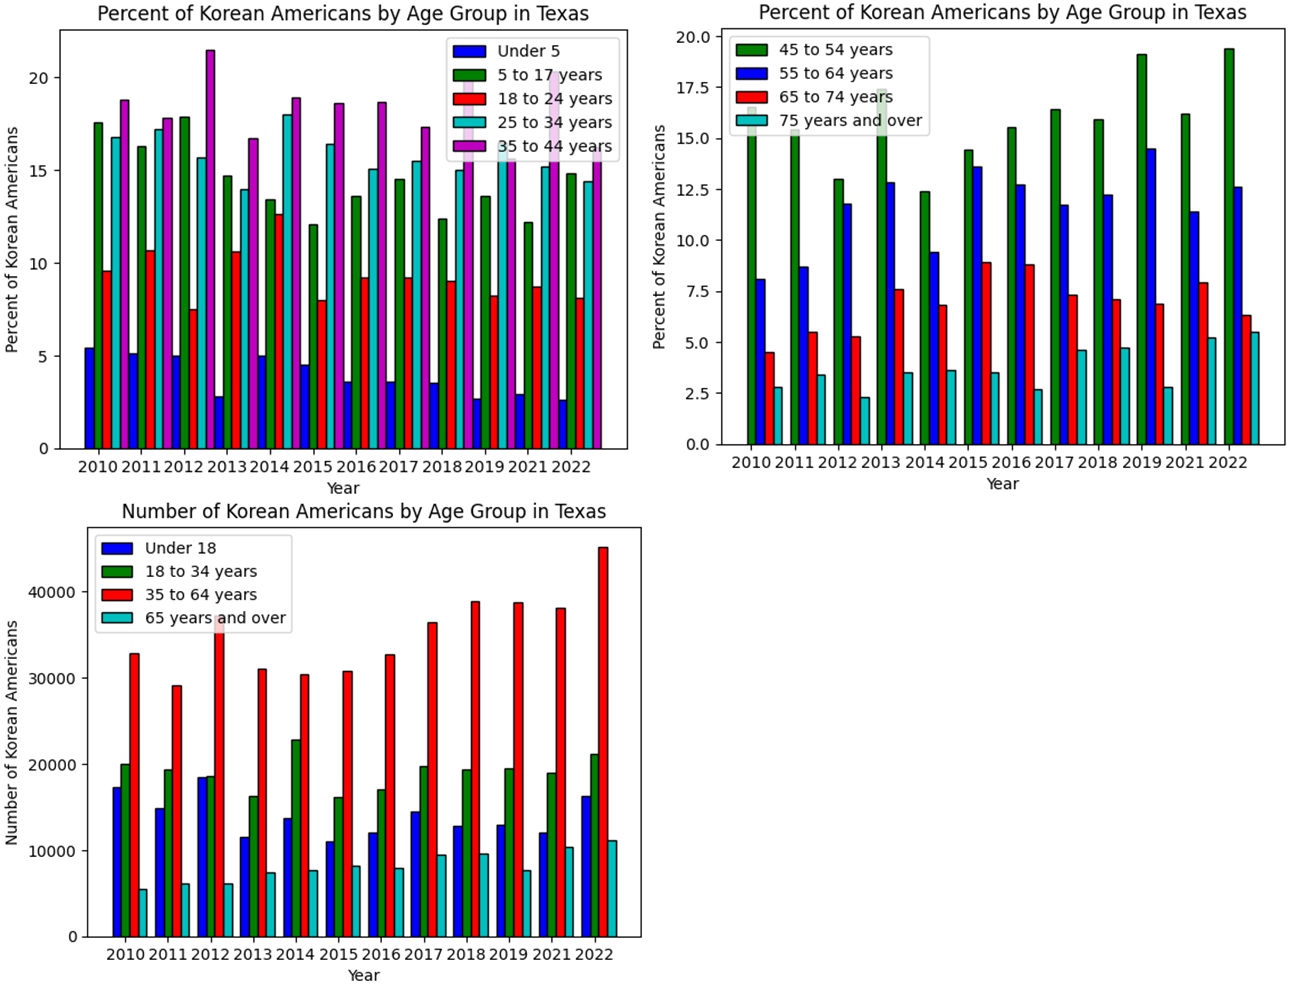
Everything’s bigger in Texas; the Korean American population being no exception. Unlike other states which either have a stagnant or decreasing total Korean American population, Texas has an increasing population. However, it’s important to know that Texas still has an aging one. In 2010, the count of Korean Americans under 18 was 17,355, comprising 23% of the demographic, a figure that decreased to 16,265, or 17.4%, by 2022. Conversely, the number of Korean Americans over 65 in 2010 stood at 5,499, representing 7.3% of the population, which would rise to 11,099, or 11.8%, in 2022. Again, though Texas does show signs of an aging Korean American population, it is on a much smaller scale than the previous states.
Most notably, Texas has an increasing population of working-age Korean Americans between 18-64 years old. In 2010, the count of Korean Americans aged 18-34 years was 19,938, and those aged 35-64 numbered 32,827, totaling 52,810. By 2022, these figures had risen to 21,113 for 18-34 and 45,201 for 35-64, amounting to a combined total of 66,314. What’s remarkable is that Texas maintains this consistent upward trend of an increasingly Korean American workforce. This could be the result of more established companies moving to Texas, and thus pulling jobs with them. We found that it may also be because Texas has a lower living cost compared to California or New York, attracting young, opportunistic Korean Americans. Lastly, we found that there is a possible shift as Korean Americans are moving away from traditionally liberal, Democratic states to Republican states because of lower living costs.
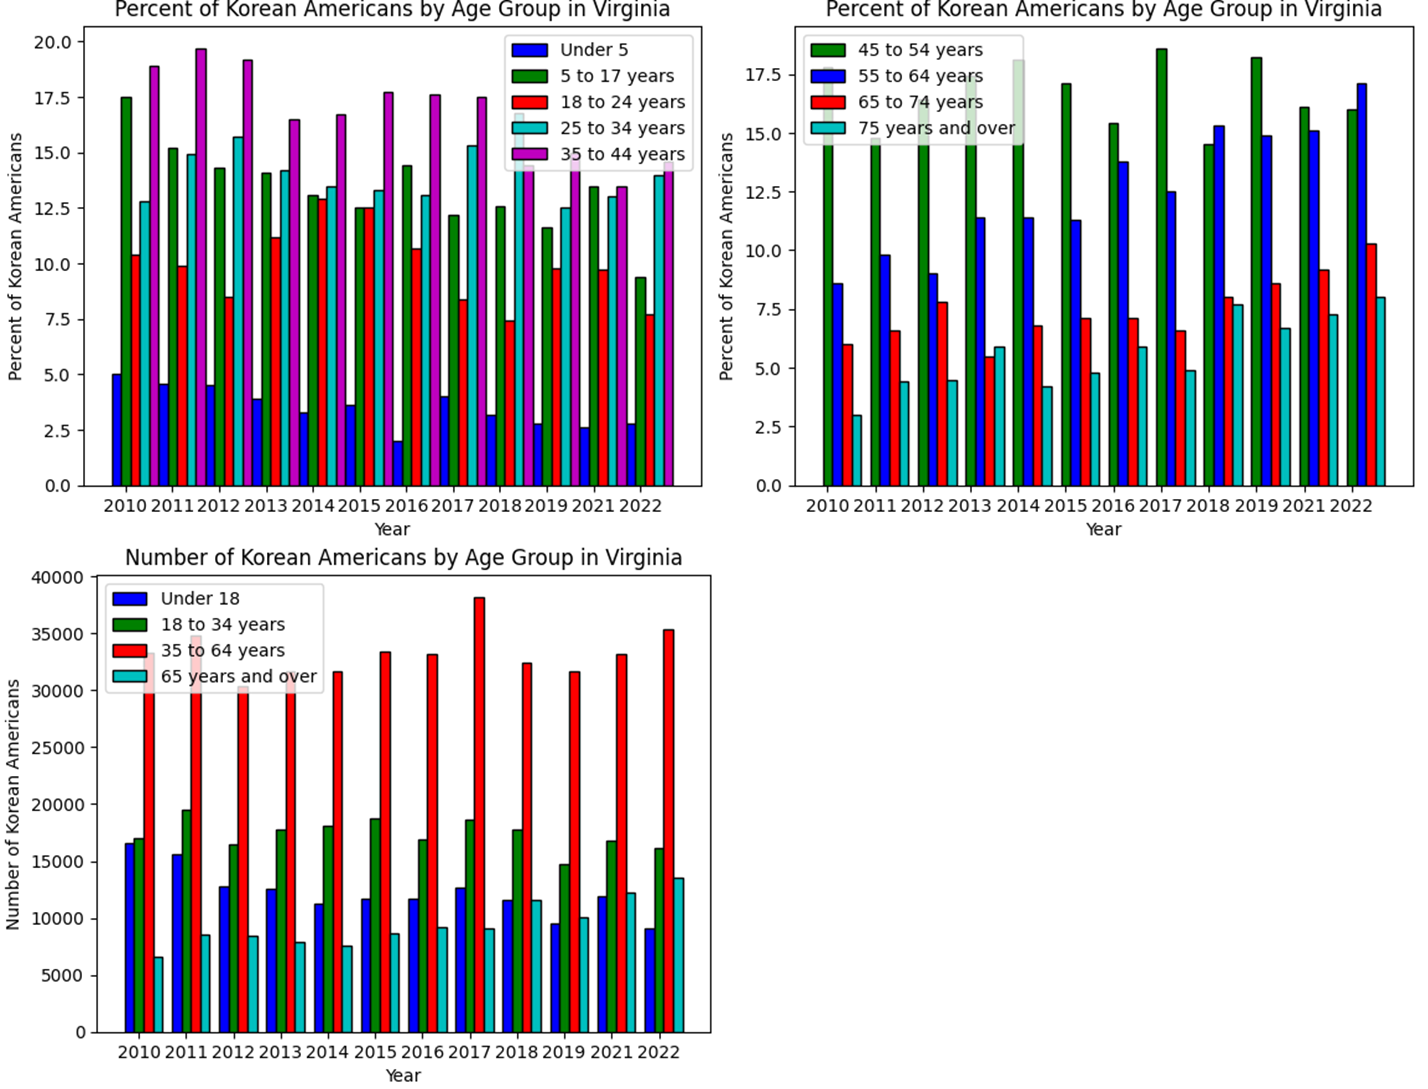
What our group found was that Virginia, in many ways, was quite similar to Texas; however, it still had key differences. In 2010, the population of individuals under 35 years old in Virginia stood at 33,565, comprising 45.7%, and would fall to 25,214, accounting for 33.9% by 2022. Concurrently, the population of Korean Americans above 65 years old in Virginia was 6,606, representing 9% in 2010, which would rise to 13,579, accounting for 18.3% by 2022. While the aging effect was worse than Texas’, it was not as harsh as other states.
Within the working class, it’s worth noting that the younger half, ages 35 to 44 years, decreased. The main contributor to the increasing size of the 35 to 64 age group was the 55 to 64 year age group. This group went from being 8.6% to 17.1% of the total Korean American population in Virginia. Although this statistic does indicate an aging effect, it is distinct from the one observed in California and New York. This age group is still able to work relative to the much more elderly population which has exploded in other states. This is similar to how New Jersey had an attraction towards workers approaching their twilight years.
As previously mentioned in the Texas section, Virginia is also a traditionally Republican state with a low cost of living. This low cost of operation also extends to businesses. The Virginia Economic Development Partnership reported that “…construction costs fall below the national average by 7% to 20%, depending on the region.” These low costs are extremely attractive to prospective businesses that want to keep costs low. These businesses bring jobs that attract potential workers with them, extending to foreign companies like those based in Korea. These companies that are looking to expand into the U.S. logically choose those states that have a higher ease of doing business. These Korean companies bring with them Korean workers and experts who then contribute to the KA population, particularly the 55-64 which is the age that most high-level company experts are at.
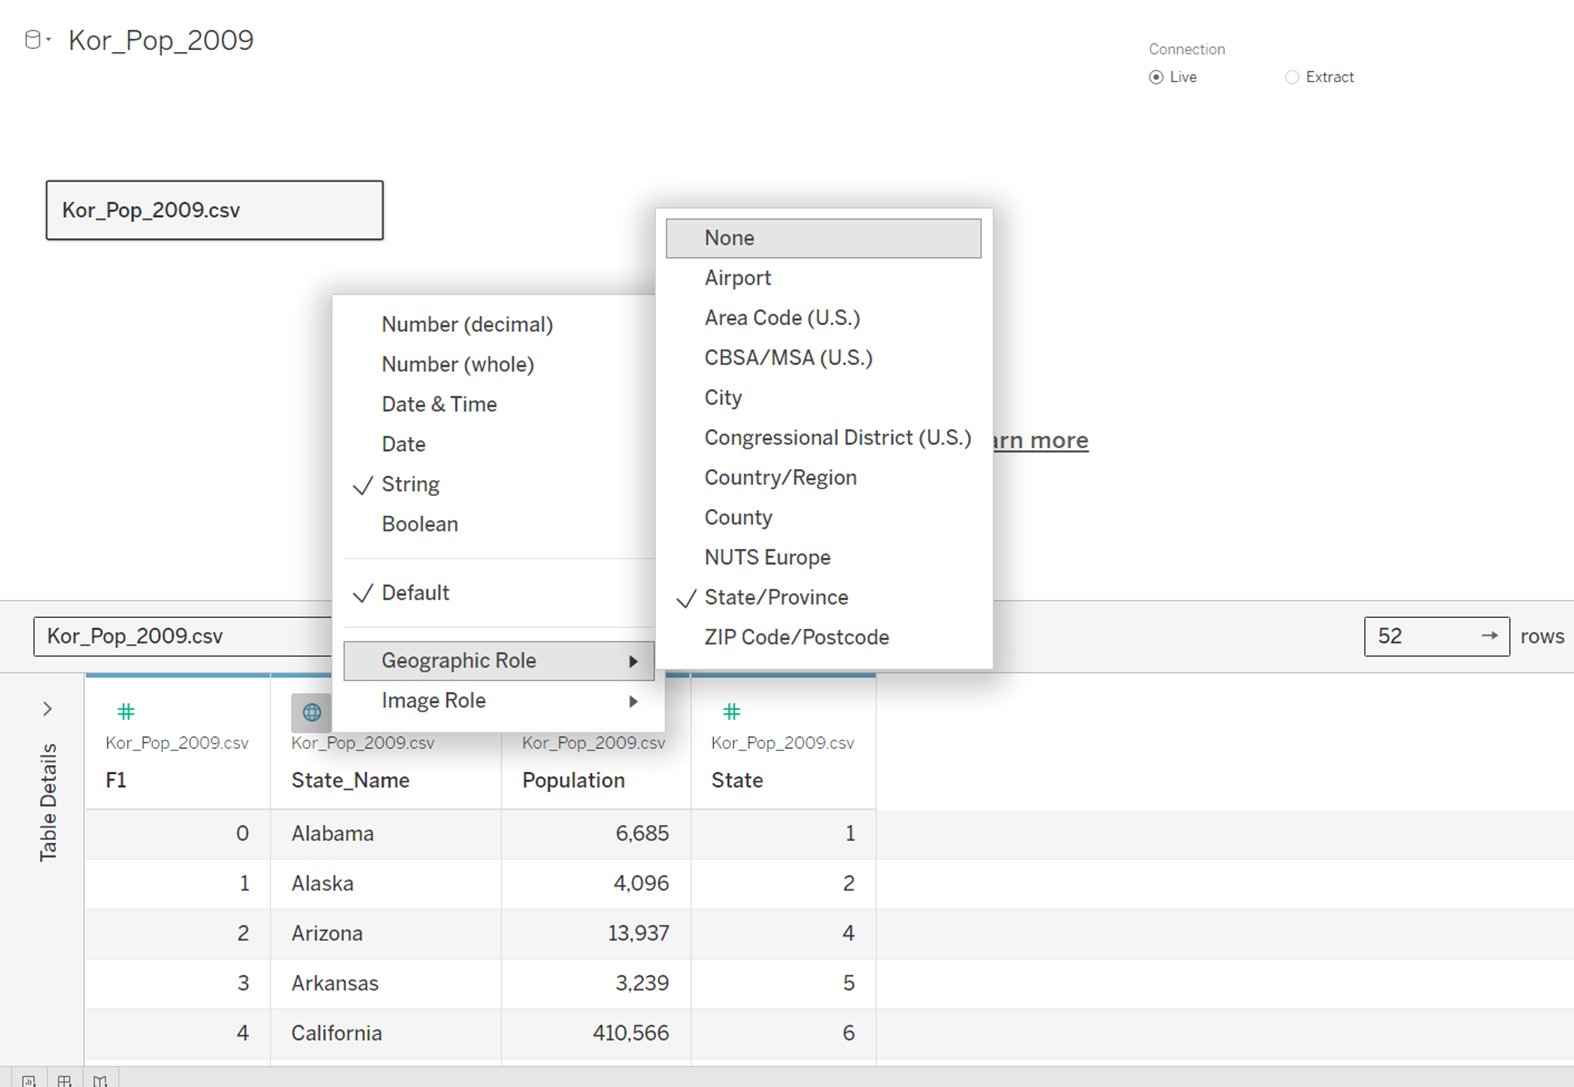
With help from our advisor Minsang Yoo, we scraped together CSV Census data to provide us with each and every state of the United States with the Korean population. With this simplified CSV data, we set each state to have its own geographic role for easy visualization through Tableau.
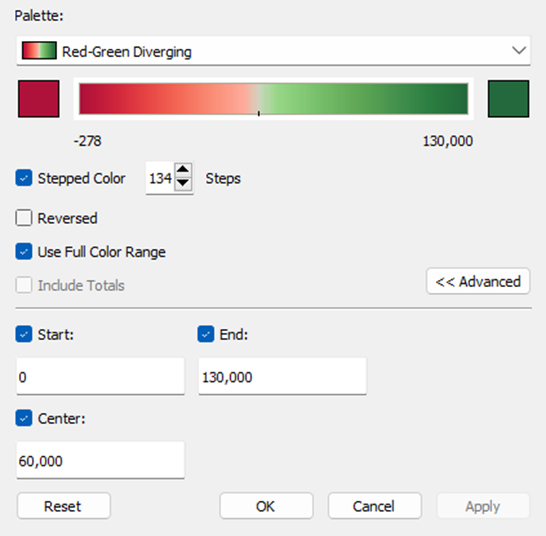
We created a map for each year from 2009 to 2021, containing the number of Korean Americans in each state as a number on the map and a color scale. However, California and New York included far too many Korean Americans compared to other states and were extreme outliers that stopped us from visualizing any significant changes from other states. To prevent this issue, we decided to exclude both states from the Tableau graphs, setting the scale from 0 to 130,000 people so we could see evident changes in color over the years in many different states other than California and New York.
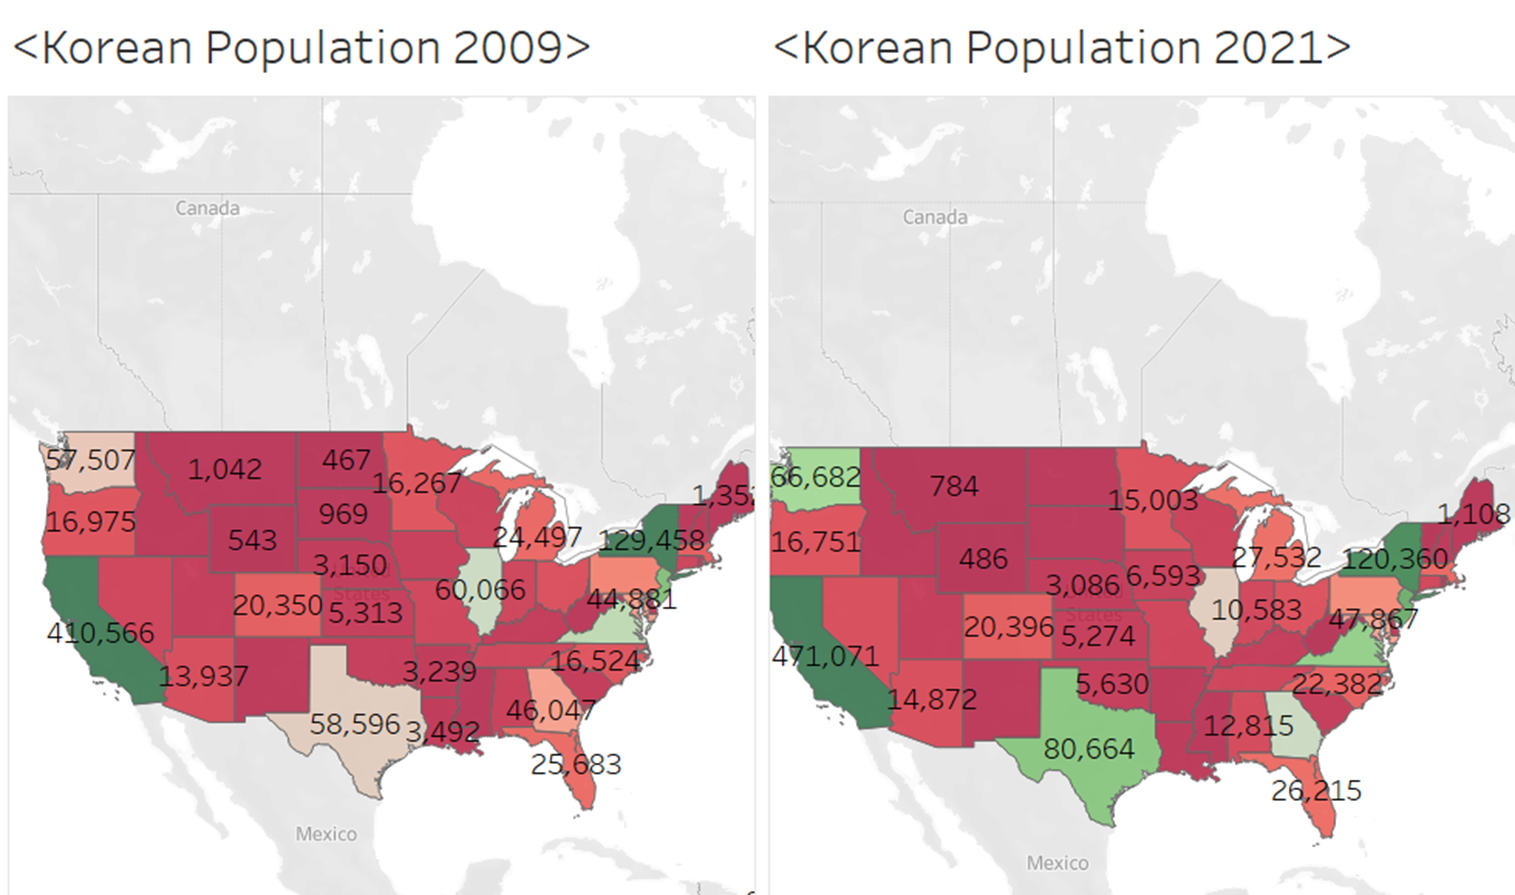
After putting the data of the 2009 and 2021 Tableau graphs side by side, we could visualize apparent shifts in the Korean population over time through color shifts from red to green. Excluding the large number of Korean Americans in California and New York, we saw a significant inflow of Korean Americans from 2009 to 2021. Between these years, Washington’s population grew by 9,175, Texas’s by 22,068, Georgia’s by 14,077, and Virginia’s by 12,180. We found that these states showed a huge population jump, as seen on the graphs through their color shifts.
We predicted that states with increasing technological job opportunities for Korean Americans were influencing these number shifts, especially in states like Texas and Georgia. One interesting state we found was Illinois. Although most states in America showed a general increase in the Korean American population, Illinois— which boasted a vast population of 60,066 Korean Americans in 2009— dropped to 58,909 over the years. One possible explanation is that the initial surge in population was driven by immigrants seeking refuge during the 1970s, particularly flocking to Illinois, especially Chicago; however, this trend did not remain consistent over the years.
Factors that Affect Population
With so many different variables that impact a person’s desire to live in a specific community, exactly pinpointing why a specific region has so many people can be difficult to track. Factors such as job opportunities, cost of living, or even climate can determine whether an area is suitable for a person. At one end of the spectrum, there are obvious factors like migration that determine population. However, other traits are much harder to determine without significant data and census analysis.
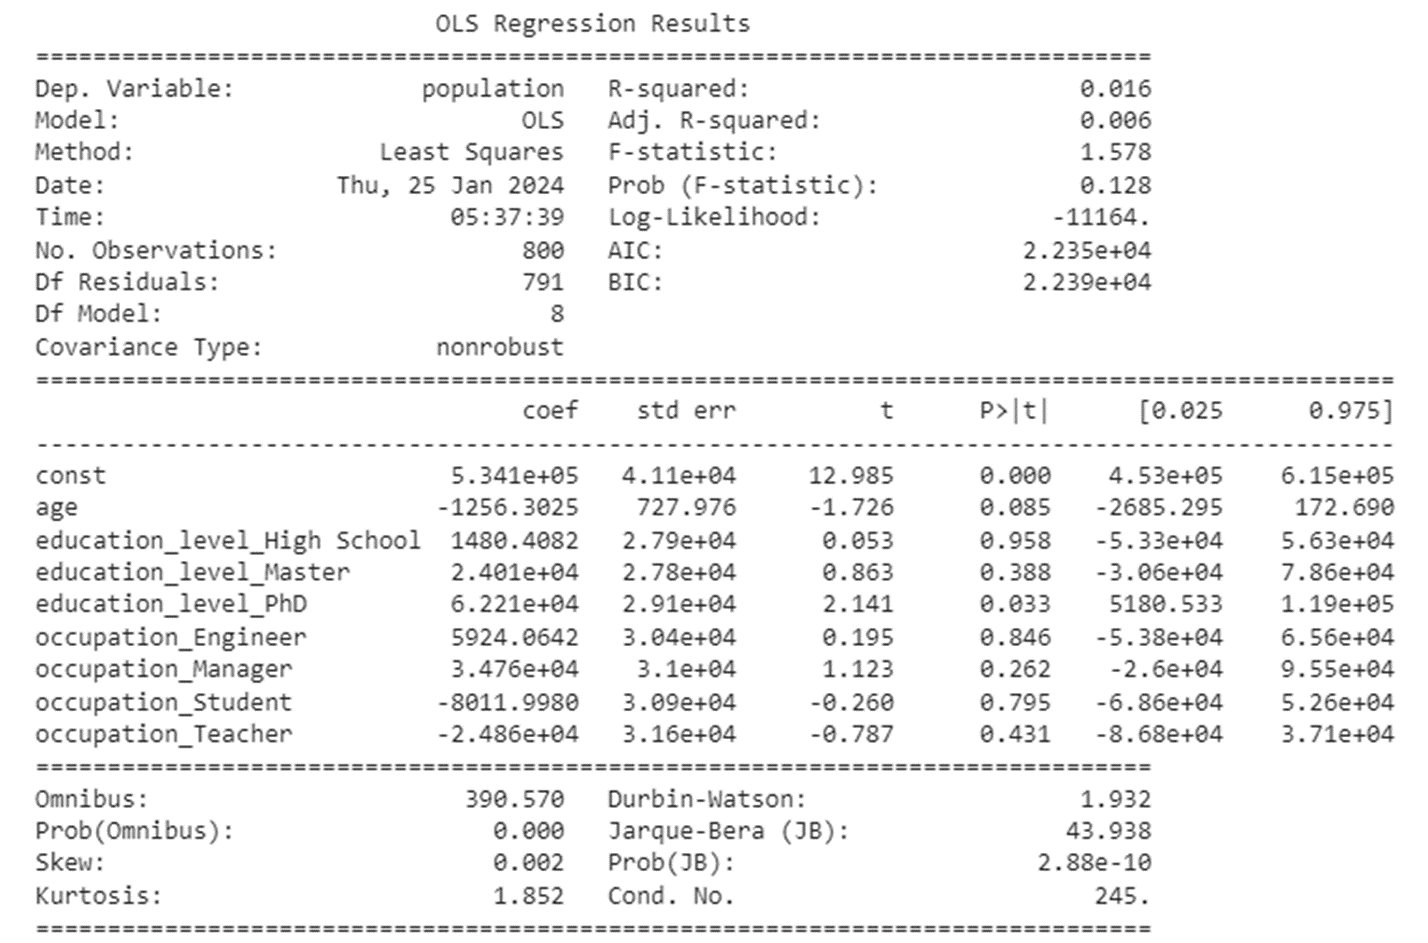
The regression table above shows examples of various education levels and occupations that a person might have within a Korean population, and the R^2 value in the top right demonstrates its ambiguity. Values close to 0 mean that the relationship between two variables has no correlation, and in this case, the relationships between age, education, or occupation do not correlate with the dependent variable of population. This regression table teaches us about how many different factors can cause population growth or decline, in turn weakening the relationship between population and its causes.
Demographics alone do not determine population growth, but rather the opportunity and benefit of living in such places. The most important factor in the population is migration. The ability to relocate to a city with vast opportunities where living situations are much better and have greater potential than native cities was significant, especially during the 1950s. As Koreans wanted to migrate especially because of financial debt and the Korean War, many relocated to the United States in areas like California, New York, or Texas to simply live more comfortable and affordable lives. Ever since, not much relocation has needed to occur since Koreans have already been successful in living in these areas with relative stability, with reproduction keeping populations stable. The most significant problem when it comes to Korean populations in recent years is the aging phenomenon discussed earlier in the article where people are aging faster than the rate of births. Despite this, it is up to life choices and advantages like metropolitan districts or culturally rich areas to stabilize and maintain Korea’s population in the States.
Final Reflection
In the culmination of our four-month journey under the guidance of USC Professor Seon Kim and his Korea Daily Data Science (KDDS) internship, we have gone deep into the demographic shifts within the Korean American population. Beginning with data sourced from the United States Census Bureau dataset, our exploration aimed to find trends and patterns within the growing Korean American communities in various states, with a particular focus on California, New York, New Jersey, Texas, and Virginia. What came from our analysis is a new understanding of a pressing issue: the aging trend within the Korean American populace.
As evidenced by our findings, the younger generation among Korean Americans is dwindling while the older generation is on the rise, signifying an overarching aging trend. While this phenomenon presents itself differently across states, with variations in population dynamics and contributing factors such as job markets, cost of living, and migration patterns, the aging trend remains consistent. From the heart of Korean Americans in California and New York to the growing cities of Texas and Virginia, the effects of aging are still felt, yet with different subtleties and consequences.
Our analysis has highlighted the complexity of changing demographics and the wide range of variables affecting population changes. Every factor, from cultural attractions to economic chances, is crucial in determining where people choose to live and prosper. Despite all of these complications, one thing is certain: the aging phenomenon is a serious issue that needs to be addressed to preserve all Korean American communities for years to come. Steps must be considered deeply and taken soon, or else Korean Americans will face a tragedy that cannot be undone. As we draw to a close our investigation, we are dedicated to finding new studies and developing strategies aimed at addressing the pressing issue of the aging trend within the Korean American population.
By: Haeun Kim, Ellis Chae, and Katelyn Yu (Under supervision of Sarah Bang)
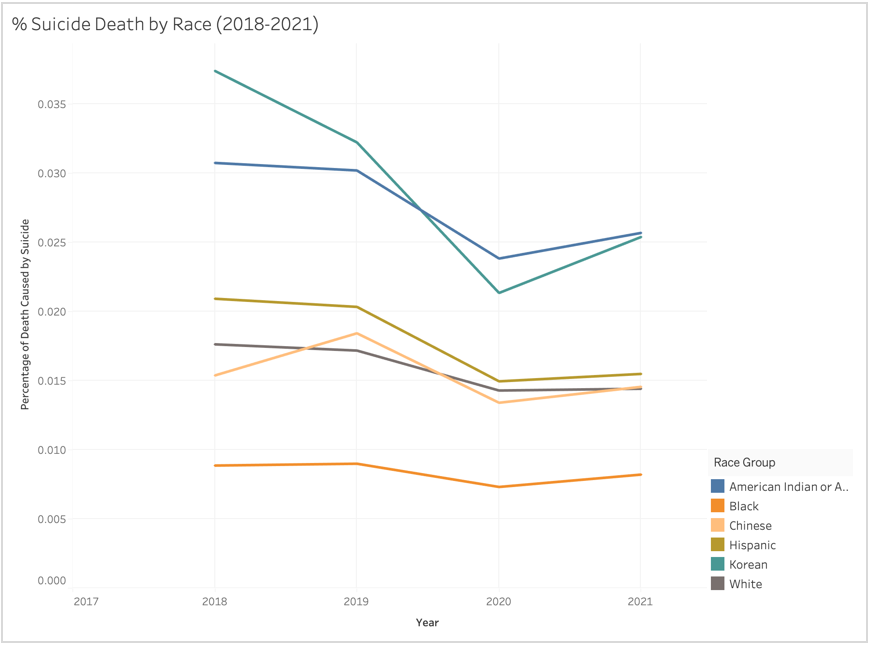
In recent years, the rise in suicide rates has transformed into a critical public health crisis, affecting people of all ages and races. From little less than 40,000 in 2011, the number of deaths due to suicide rose to 48,495 in 2018. However, between 2018 and 2019, there was a minor decline in which the number of deaths reached 47,674. And this decline continued into the pandemic year of 2020 until it rose again in 2021. Specifically, Koreans were the race that had the highest number of deaths due to suicide in the US (excluding multiracial groups) until 2020, when it ranked 2nd after American Indians and Alaska Natives. In 2018, 3.74% of deaths for Korean Americans were from suicide. But in 2020, the percentage dropped down to 2.13%. The drop in the number of suicides in 2020 is apparent for all races (American Indian or Alaska Native, Asian Indian, Black, Chinese, Filipino, Hawaiian, Hispanic, Japanese, Korean, Vietnamese, and White). However, the drop is most significant for Korean Americans as it dropped 1.09% from the previous year, whereas other races experienced a drop between 0.119% ~ 0.738%.
So why did the number of suicides drop in 2020? When the pandemic hit in 2020, the US saw a spike in the homicide rate and drug overdose deaths. Particularly after the number of suicides increased in previous years until 2019, it can be assumed that the number and rate of suicides in the nation would follow that pattern. Especially after the risk factors for suicide increased during 2020, such as mental health issues like depression, anxiety, and job and financial stress, it’s easier to predict that the rate would increase. However, the factors influencing suicide rates are multifaceted, so an increase in risk factors doesn’t mean an increase in suicide deaths, as the prevention factors also increased during that year.
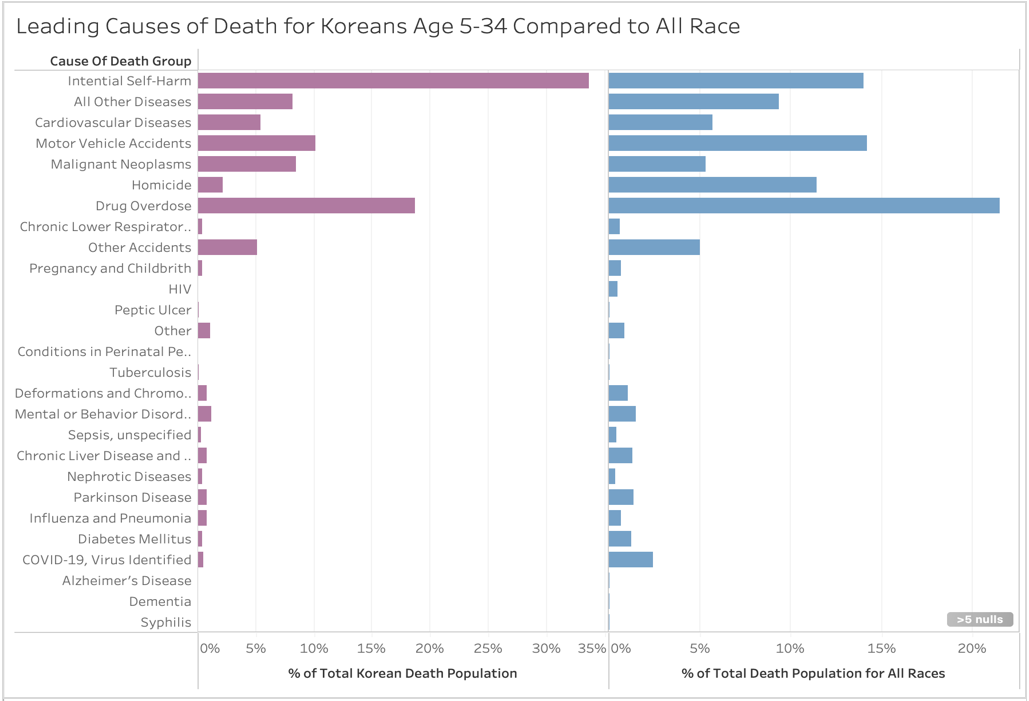
But even with the decrease in 2020, suicide has been the leading cause of death for Korean Americans ages 5-34 each year throughout 2018-2021. It has been the case for all Asian races (Asian Indian, Chinese, Filipino, Korean, Japanese, Vietnamese), American Indians & Alaska Natives, and Hawaiians. But compared to all the races, deaths due to suicide are significantly higher for Koreans for ages 5-34. In those years, 33.65% of deaths for Korean teens and young adults in American were due to suicide versus 14.01% for all races.
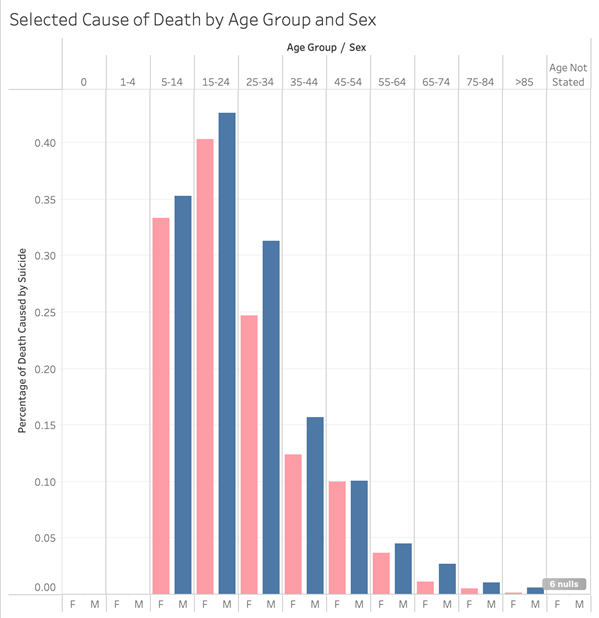
Looking at age groups and sex, men always had higher suicide rates for all years from 2018-2021. Men in age group 15-24 had the highest death due to suicide (42.61%), followed by ages 5-14 (35.29%) and 25-34 (31.33%). The percentage for women was lower by 2.33% for ages 15-24, 1.96% for ages 5-14, and 6.66% for ages 25-34.
Koreans had the highest suicide rate for age group 5-34 out of all races.
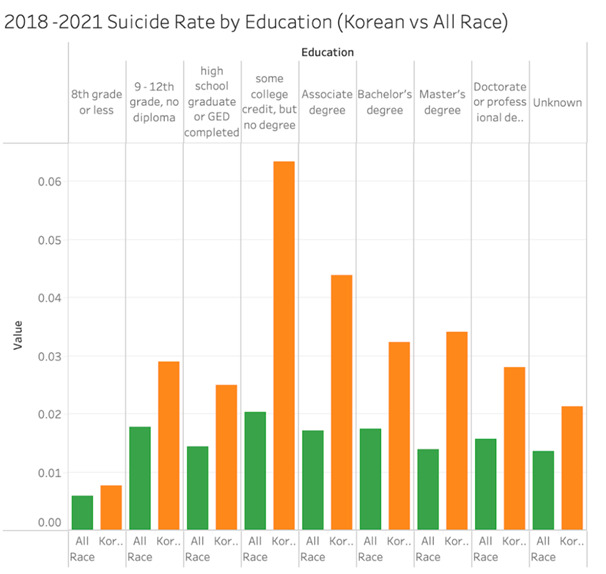
Education-wise, Koreans had higher deaths due to suicide in all education groups than the average of all races. The highest difference is shown in the some college credit but no degree group, which has a percentage of 63.44%. The differences in suicide rates between Koreans and all races are more apparent in higher education groups. The highest difference is shown in people who have some college credit, and the difference starts to decrease as the education level gets higher.
In summary, suicide rates among Korean Americans showed a significant decline in 2020 despite the challenges posed by the pandemic. However, it remains a pressing public health issue, especially among Korean American youth, consistently ranking as the leading cause of death for ages 5-34.
It’s important to note that the absence of population data limits the ability to calculate rates per 100,000 people. Without knowing the population size for each demographic group, we cannot accurately determine the prevalence of suicides relative to the population. Therefore, interpretations should be made with caution, recognizing the need for comprehensive population data to provide a more accurate rate of suicides within specific demographics.